Advanced Text Formatting in R STUDIO Graphs: Superscripts and Subscripts
Sometimes, when creating graphs using R, there may be a need to include superscripts or subscripts in axis text or titles. In this post, I will introduce about how to enter text with superscripts or subscripts.
I will generate one simple data and draw a graph to demonstrate.
# to generate data
Genotype= c("A","B")
Yield= c(100,120)
dataA= data.frame(Genotype,Yield)

# to draw a graph
library(ggplot2)
ggplot(data=dataA, aes(x=Genotype, y=Yield)) +
  geom_bar(stat="identity",position="dodge", width=0.8,
           color="black", size=1.5) +
  scale_y_continuous(breaks = seq(0,150,30), limits = c(0,150)) +
  labs(x="Genotype", y="Yied") +
  theme_grey(base_size=18, base_family="serif")+
  theme(axis.line=element_line(linewidth=0.5, colour="black"))+
  windows(width=8, height=5)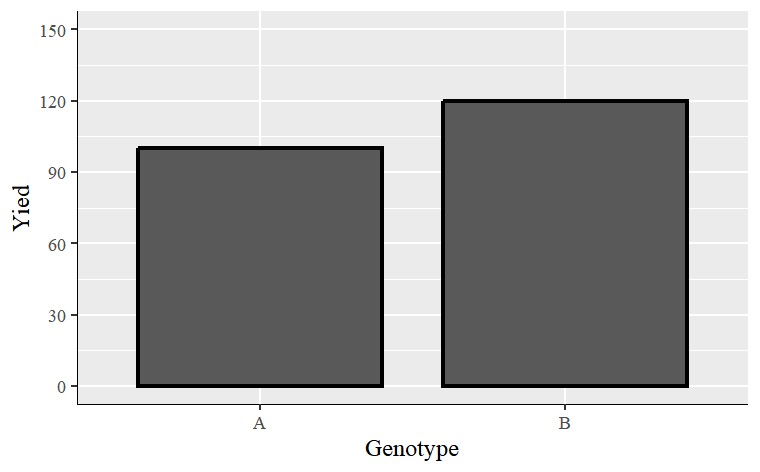
Here, I want to add superscripts or subscripts to the axis titles of the graph. For example, for the x-axis, I want to name it as “GenotypeTM” and for the y-axis, I want to name it as “Yield (ton ha-1)”.
1) How to add superscripts to the axis titles?
I’ll add subscripts to the x-axis title. I introduce two codes.
labs(y=bquote("Yield (ton ha"^"-1"*")")) +
labs(y=bquote("Yield (ton"~ha^-1*")")) +
Both codes will show Yield (ton ha-1), but there is a slight subtle difference between the two codes.
ggplot(data=dataA, aes(x=Genotype, y=Yield)) +
  geom_bar(stat="identity",position="dodge", width=0.8,
           color="black", size=1.5) +
  scale_y_continuous(breaks = seq(0,150,30), limits = c(0,150)) +
 #code 1
  labs(x="Genotype", y=bquote("Yield (ton ha"^"-1"*")")) +
 #code 2
  labs(x="Genotype", y=bquote("Yield (ton"~ha^-1*")")) +
  theme_grey(base_size=18, base_family="serif")+
  theme(axis.line=element_line(linewidth=0.5, colour="black"))+
  windows(width=8, height=5)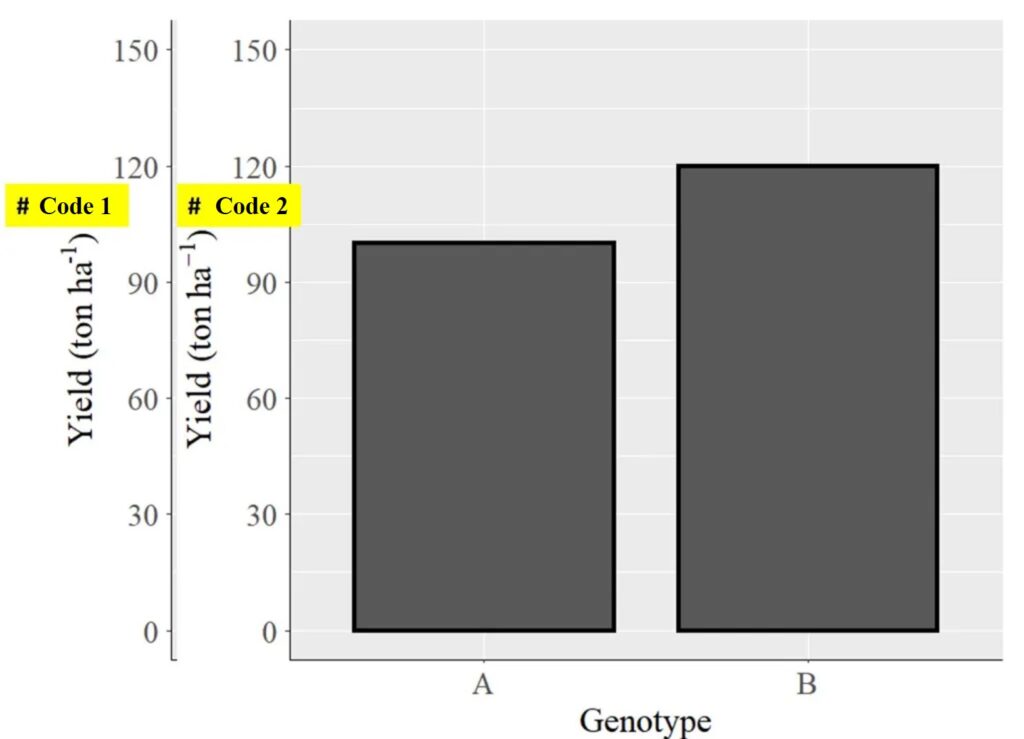
Please note the difference in the subscript -1. In the second code, the subscript appears to be more distinct. Therefore, I usually use a code structure like bquote(“Yield (ton“~ha^-1*”)“))
2) How to add subscripts to the axis titles?
Now, I’ll add subscripts to the y-axis title using this code; bquote("Genotype"["TM"])
ggplot(data=dataA, aes(x=Genotype, y=Yield)) +
  geom_bar(stat="identity",position="dodge", width=0.8,
           color="black", size=1.5) +
  scale_y_continuous(breaks = seq(0,150,30), limits = c(0,150)) +
  labs(x=bquote("Genotype"["TM"]), y=bquote("Yield (ton"~ha^-1*")")) +
  theme_grey(base_size=18, base_family="serif")+
  theme(axis.line=element_line(linewidth=0.5, colour="black"))+
  windows(width=8, height=5)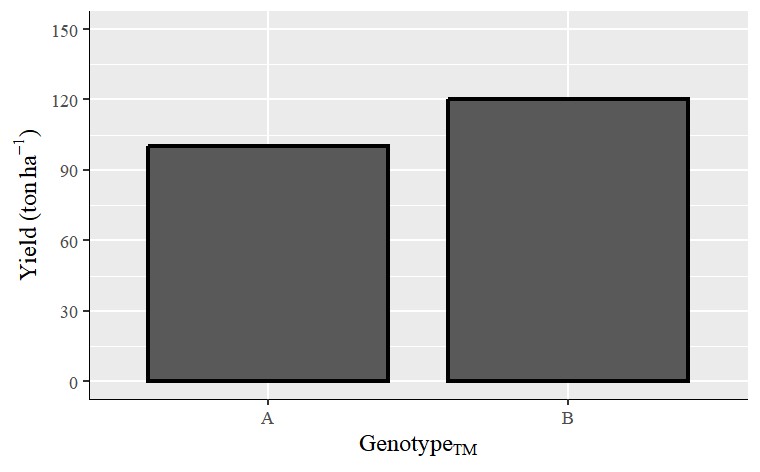
3) How to add both superscript and subscripts to the axis titles?
How about adding both superscript and subscripts?
The net CO2 assimilation rate is the net amount of assimilated carbon dioxide and is often measured as an indicator of photosynthetic capacity, indicating how much more carbon the crop can absorb. The unit is μ mol CO2 m-2 s-1. If the y-value represents the net CO2 assimilation rate, I want to add the text; CO2 assimilation rate (μ mol CO2 m-2 s-1) to the y-axis title.
The corresponding code is as follows: bquote("CO"["2"]~"assimilation rate"~(mu~mol ~CO[2]~ m^-2~s^-1)))
ggplot(data=dataA, aes(x=Genotype, y=Yield)) +
  geom_bar(stat="identity",position="dodge", width=0.8,
           color="black", size=1.5) +
  scale_y_continuous(breaks = seq(0,150,30), limits = c(0,150)) +
  labs(x=bquote("Genotype"["TM"]),
       y=bquote("CO"["2"]~"assimilation rate"~(mu~mol ~CO[2]~ m^-2~s^-1))) +
  theme_grey(base_size=18, base_family="serif")+
  theme(axis.line=element_line(linewidth=0.5, colour="black"))+
  windows(width=8, height=5)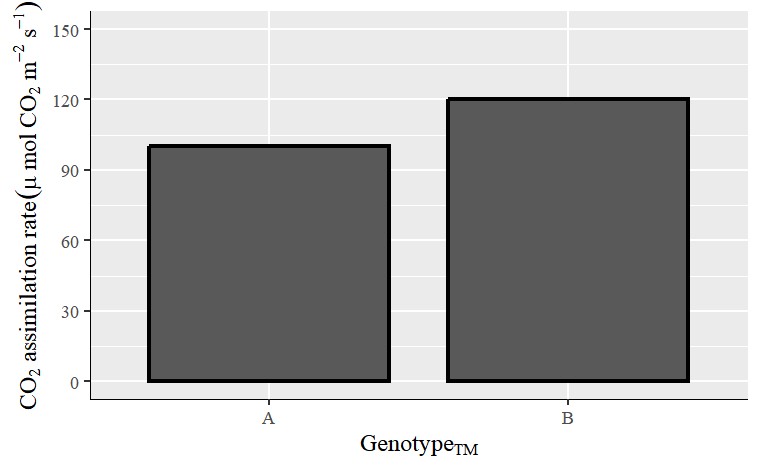
4) How to add superscript and subscripts to the axis text?
Let’s try to add superscripts and subscripts to the axis text. I would like to axis text name A as AEurope and B as BAsia. The code is as follows: scale_x_discrete(limits=c("A","B"), label= c(bquote("A"^"Europe"), bquote("B"["Asia"])))
ggplot(data=dataA, aes(x=Genotype, y=Yield)) +
  geom_bar(stat="identity",position="dodge", width=0.8,
           color="black", size=1.5) +
  scale_y_continuous(breaks = seq(0,150,30), limits = c(0,150)) +
  scale_x_discrete(limits=c("A","B"),
                   label= c(bquote("A"^"Europe"),
                            bquote("B"["Asia"]))) +
  labs(x=bquote("Genotype"["TM"]),
       y=bquote("CO"["2"]~"assimilation rate"~(mu~mol ~CO[2]~ m^-2~s^-1))) +
  theme_grey(base_size=18, base_family="serif")+
  theme(axis.line=element_line(linewidth=0.5, colour="black"))+
  windows(width=8, height=5)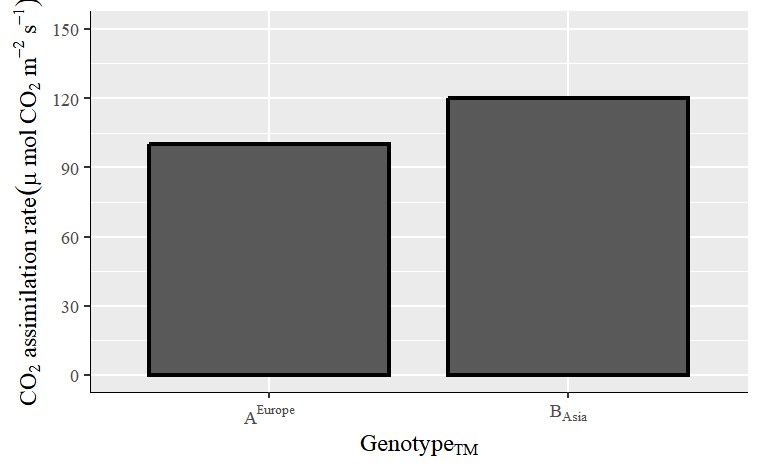
Here is the complete code for the above graph. If you are new to R, copy and paste the code below into the R script window and try it out.
Genotype= c("A","B")
Yield= c(100,120)
dataA= data.frame(Genotype,Yield)

library(ggplot2)
ggplot(data=dataA, aes(x=Genotype, y=Yield)) +
  geom_bar(stat="identity",position="dodge", width=0.8,
           color="black", size=1.5) +
  scale_y_continuous(breaks = seq(0,150,30), limits = c(0,150)) +
  scale_x_discrete(limits=c("A","B"),
                   label= c(bquote("A"^"Europe"), bquote("B"["Asia"])))  +
  labs(x=bquote("Genotype"["TM"]),
       y=bquote("CO"["2"]~"assimilation rate"~(mu~mol ~CO[2]~ m^-2~s^-1))) +
  theme_grey(base_size=18, base_family="serif")+
  theme(axis.line=element_line(linewidth=0.5, colour="black"))+
  windows(width=8, height=5)
code summary: https://github.com/agronomy4future/r_code/blob/main/Advanced_Text_Formatting_in_R_STUDIO_Graphs_Superscripts_and_Subscripts.ipynb