How to reorder variables in R for data analysis?
I’ll now show you how to change the order of variables in a graph. For this example, I have prepared some data and will create a graph using it.
Fertilizer=c("Urea","Calcium Nitrate","Sodium Nitrate","Amonium Sulfate")
Yield=c(100,90,80,130)
std_error=c(8.3,7.8,9.2,4.9)
dataA=data.frame(Fertilizer,Yield,std_error)
dataA

   Fertilizer        Yield   std_error
1  Urea              100     8.3
2  Calcium Nitrate   90      7.8
3  Sodium Nitrate    80      9.2
4  Amonium Sulfate   130     4.9

# to draw a graph
library(ggplot2)
ggplot(data=dataA, aes(x=Fertilizer, y=Yield)) +
  geom_bar(stat="identity",position="dodge", width = 0.5) +
  geom_errorbar(aes(ymin=Yield-std_error, ymax=Yield+std_error),
                position=position_dodge(0.5) ,width=0.2) +
  scale_y_continuous(breaks = seq(0,150,50), limits = c(0,150)) +
  theme_grey(base_size=18, base_family="serif")+
  theme(legend.position="none",
        axis.line= element_line(linewidth=0.5, colour="black"))+
  windows(width=7, height=5)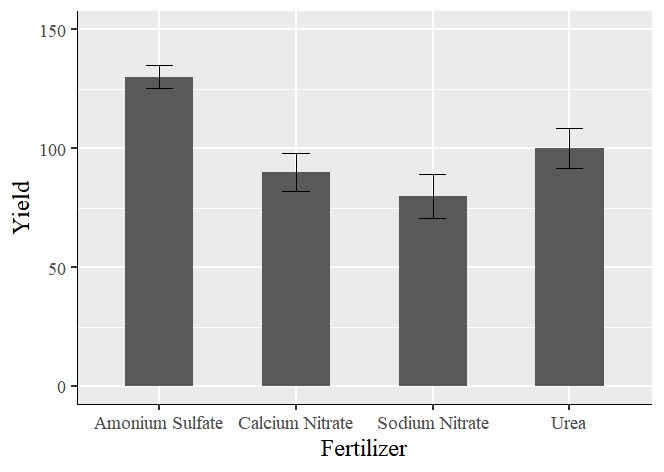
Now, let’s re-order the variables so that Calcium Nitrate comes first, followed by Urea, then Sodium Nitrate, and lastly Ammonium Sulfate.
First, let’s take a look at the variables:
library(base)
levels(factor(dataA$Fertilizer))

[1] "Amonium Sulfate" "Calcium Nitrate" "Sodium Nitrate"  "Urea"
The variables in R are currently ordered alphabetically by default. The following code will change the order of the variables as desired:
dataA$Fertilizer=factor(dataA$Fertilizer, levels=c("Calcium Nitrate","Urea","Sodium Nitrate","Amonium Sulfate")) 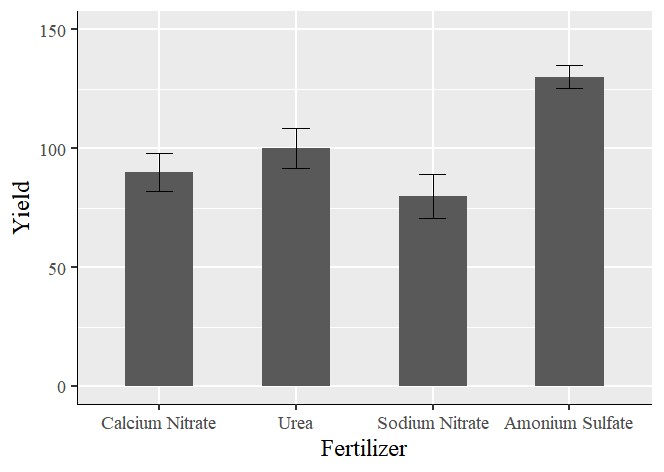
© 2022 – 2023 https://agronomy4future.com