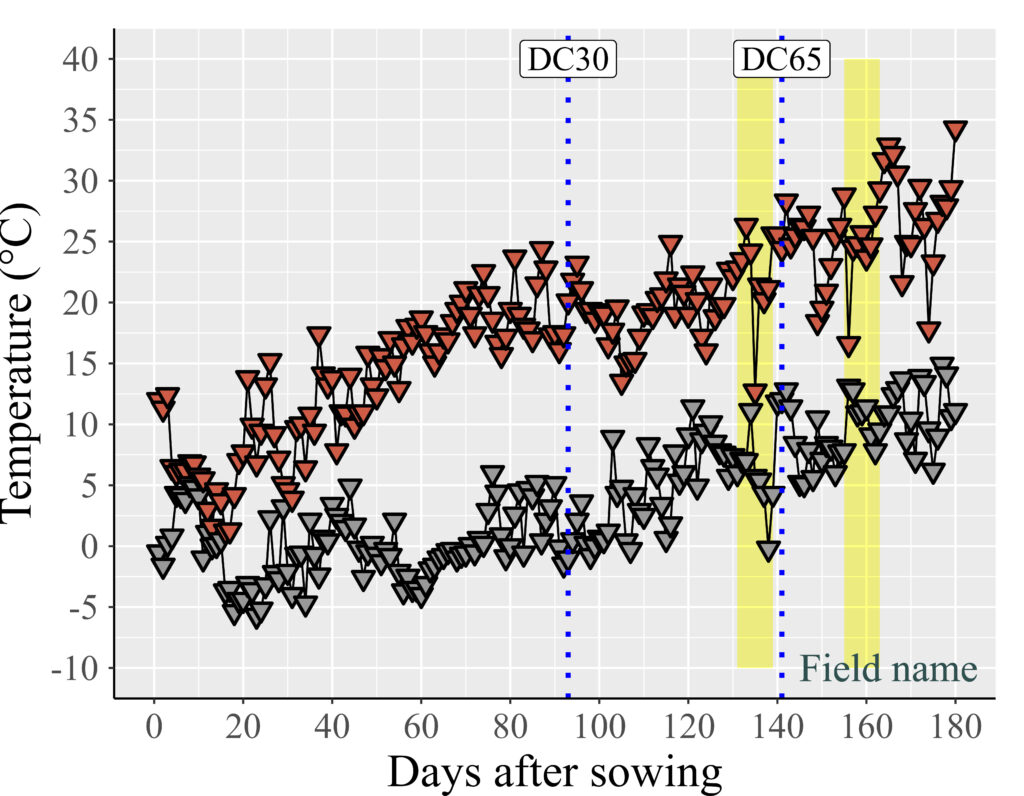
Example of a Time Series Graph for Temperature Using R

# data upload
library(readr)
github="https://raw.githubusercontent.com/agronomy4future/raw_data_practice/main/weather_data_example.csv"
dataA= data.frame(read_csv(url(github), show_col_types= FALSE))

# to create a graph
Fig1= ggplot(data=subset(dataA, Category!="MEAN"), aes(x=Days_from_sowing, y=Temp, shape=Category, fill=Category)) +
  geom_rect(aes(xmin=131, xmax=139, ymin=-10, ymax=40),
            fill=alpha("yellow",0.0025), linetype=8, size=1) +
  geom_rect(aes(xmin = 155, xmax=163, ymin=-10, ymax=40),
            fill=alpha("yellow",0.0025), linetype=8, size=1) +

  geom_line (size=0.5,linetype="solid") +
  geom_point(size=3, stroke=1.2) +
  scale_shape_manual(values=c(25,25)) +
  scale_fill_manual(values=c("coral3","grey60")) +
  scale_x_continuous(breaks=seq(0,180,20),limits=c(0,180)) +
  scale_y_continuous(breaks=seq(-10,40,5),limits=c(-10,40)) +

  geom_text(aes(family="serif",fontface=6), x=165, y=-10,
            label="Field name", size=7, col="Darkslategray") +

  geom_vline(xintercept=141, linetype="dotted", size=1.2,color = "Blue") +
  geom_label(aes(family="serif",fontface=6), x=141, y=40,
             label="DC65", size=6, fill="white", col="Black") +

  geom_vline(xintercept=93, linetype="dotted", size=1.2,color = "Blue") +
  geom_label(aes(family="serif",fontface=6), x=93, y=40,
             label="DC30", size=6, fill="white", col="Black") +

  labs(x="Days after sowing", y="Temperature (°C)") +

  theme_grey(base_size=20, base_family="serif") +
  theme(legend.position="none",
        legend.title=element_blank(),
        legend.key=element_rect(color="white", fill="white"),
        legend.text=element_text(family="serif", face="plain",
                                 size=13, color= "Black"),
        legend.background=element_rect(fill="white"),
        axis.line=element_line(linewidth=0.5, colour="black"))
Fig1+windows(width=7, height=5.5)

# to save a graph to your PC
ggsave("C:/Users/Desktop/FIG1.jpg", FIG1, width= 18, height= 14, units= "cm", dpi = 1000)
© 2022 – 2023 https://agronomy4future.com