How to calculate pooled variance when including block in the experimental design?
New equation I suggest!!

You might be already familiar with how to calculate pooled variance. This story is about pooled variance when blocks exist. If you run statistics programs, you’ll simply obtain pooled variance (also known as MSE), but you’ll never understand the concept of pooled variance if you just run software programs.
Here is an example data. Let’s say this is a yield data.
| Cultivar A | Cultivar B |
| 120 | 70 |
| 130 | 90 |
| 110 | 50 |
| Mean: 120 Variance (s2): 100 | Mean: 70 Variance (s2): 400 |
I’d like to know there is a difference between two cultivars. I’ll compare two independent groups. So, ‘2-sample t test’ would be good to analyze data. If you run statistics, you can get the outcome in 10 seconds.
A<-c(120,130,110)
B<-c(70,90,50)
t.test(A, B, mu=0, var.equal=T, conf.level=0.95, alternative="two.sided")
It shows significant difference between two groups (p-value: 0.01795).
Now, I’d like to calculate t value (t= 3.873) and the statistical outcome by hand.
The below equation is to calculate t-value in ‘2-sample t test.’

We already know the mean of each group (x̄1 = 120 , x̄2 = 70). Only we need to calculate standard error (SE). Standard error is calculated by dividing standard deviation (s) by square root of sample number (n)
Std. Error = s / √n
The first question starts from here.
“There are two groups. which group’s standard deviation we need to use? “
We need a new standard deviation which can be applied in both groups. It’s called “pooled variance (or pooled standard deviation).” Square root of variance is standard deviation (√v = s) . So, the term is not important. From now on, I’ll say ‘pooled variance.’
Then, the second question would be ‘How to obtain ‘pooled variance?‘
How to obtain pooled variance?
The equation to calculate pooled variance is

where s12 and s22 are variance and n1 and n2 are sample number in each group.
Let’s calculate the pooled variance between two groups.

The value is pooled variance (s2) = ((3-1)*100 + (3-1)*400) / ((3-1) + (3-1)) = 250.
Then, pooled standard deviation (s) will be √250 = 15.81139
How to calculate test statistic t value?
As mentioned earlier, Std. Error = s / √n
However, when pooled standard deviation between two groups is used, the standard error will be calculated as
Std. Error = pooled STDEV * (√1/n1 + 1/n2)
Therefore, Std. Error between two group = 15.81139 * (√1/3 + 1/3) ≈ 12.91
15.81139 * sqrt (1/3+1/3) # 12.90995Now, we can calculate test statistic t-value as
t = (120 – 70) / 12.91 = 3.872967 ≈ 3.873
It’s the same value R provided.
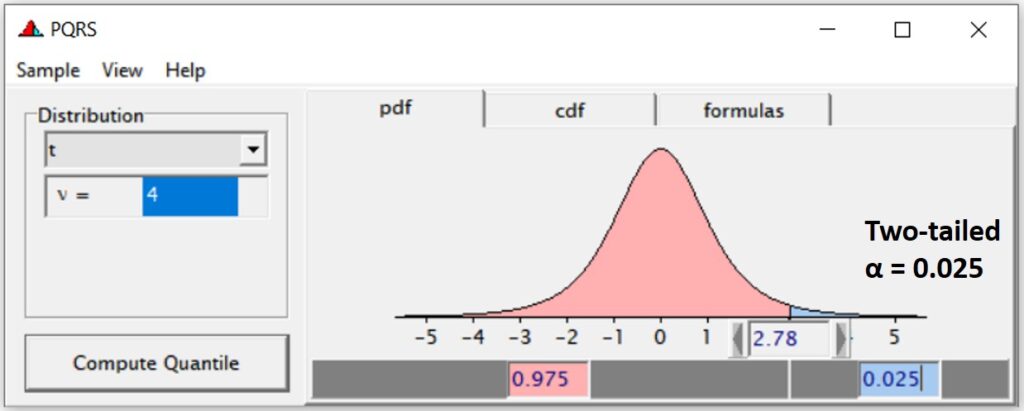
When df=4, the critical t-value (α=0.05) is 2.78 (This is two-tailed teat; “same” or “not the same”, therefore, in each tail, α = 0.025).

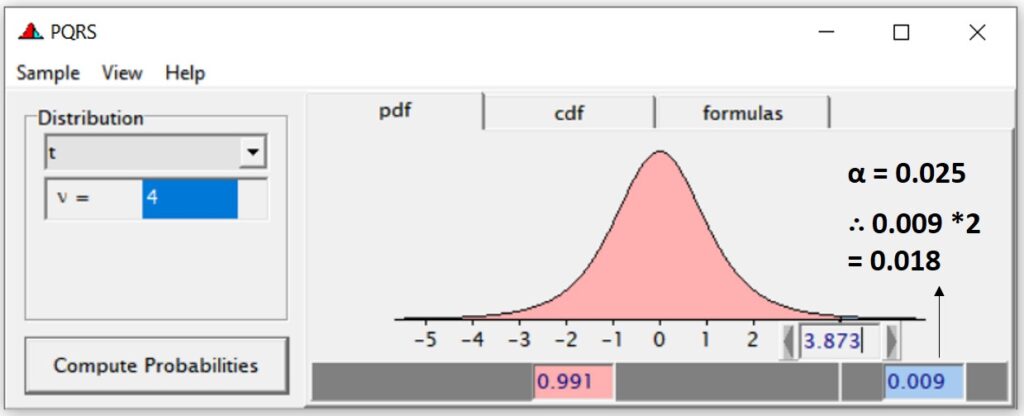
When test statistic t value is greater than 2.78, it would be significant (as p-value <0.05). So, there is yield difference between two groups. Let’s check the p-value about our test statistic t value, 3.873.

In t-distribution, when t value is 3.873, the area of α is 0.009. However, it’s two-tailed test. So, we should multiply 0.009 by 2 (as we set up α=0.05).
The p-value is 0.018. It’s the same p-value in R.
Let’s focus on the equation of pooled variance
I explained why we need to calculate pooled variance and how it is used to calculate t-value.

In ANOVA table, MSE is the pooled variance. Let’s analyze the data by ANOVA. It would be One-Way ANOVA (because there is only one factor; cultivar).
Cultivar<- rep(c("CV1","CV2"),each=3)
Yield<- c(120,130,110,70,90,50)
dataA<- data.frame (Cultivar,Yield)

summary(aov(Yield ~ Cultivar, data=dataA))
Here, see the Mean squared Error (MSE)!! It’s 250 which is the same value I calculated by hand.
Let’s go back to the data. Now you can see the difference from previous one.
| Block | Group A | Group B |
| I | 120 | 70 |
| II | 130 | 90 |
| III | 110 | 50 |
| Mean: 120 Variance: 100 | Mean: 70 Variance: 400 |
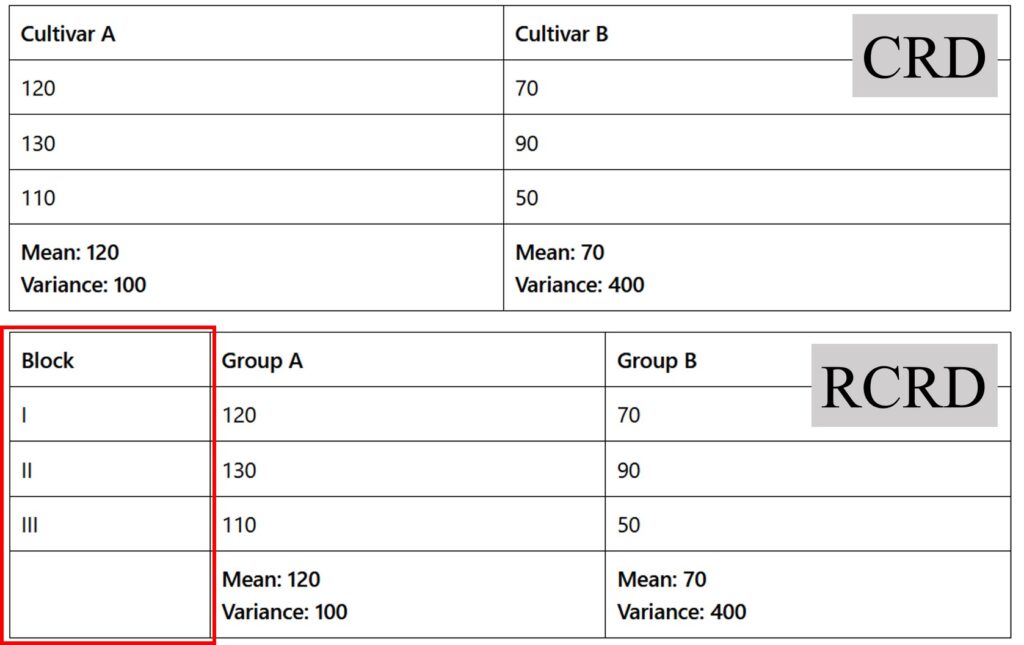
Block is included in the data. This experimental design is called RCBD (Randomized Complete Block Design). The previous data (experimental design) is called CRD (Completely Randomized Design).
The below figure well explains the difference between CRD and RCBD.

When including blocks in the experimental design, MSE tends to be decreased as blocks absorb errors. For example, if the red zone is flooded, we’ll lose most data in CRD, but only one block was lost in RCBD.
Let’s do ANOVA again. In this time, it will be One-Way ANOVA with Block.
Cultivar<- rep(c("CV1","CV2"),each=3)
Block<- rep(c(1,2,3),times=2)
Yield<- c(120,130,110,70,90,50)
dataA<- data.frame (Cultivar,Block, Yield)

summary(aov(Yield ~ Cultivar + factor(Block), data=dataA))
Please see the MSE. In CRD, MSE (pooled variance) was 250, but now it’s 50.
Block absorbed some errors and therefore, less MSE will increase statistical significance, increasing F-value.
Remember!!
F-value = MST / MSE
So, when MSE is decreased, F-value will be increased, and results in more significance (=less p-value).
Can we use the same equation of pooled variance when including blocks?
In RCBD, no data was changed. Only block was included. So, in RCBD, when you calculate pooled variance using the same equation, you’ll obtain the same value as in CRD.

However, in RCBD, the pooled variance is 50. Therefore, the equation is wrong in RCBD.
Many statistical books/references always introduce the equation of pooled variance as

However, the equation of pooled variance we commonly know is only possible in CRD. On the other hand, in RCBD, we cannot use the equation as it does not consider block.
New equation of pooled variance in RCBD
Then, in RCBD, what equation we can use to calculate pooled variance?
I was trying to find a new equation of pooled variance for RCBD, and this is my suggested equation.

Let’s re-organize the data including blocks.
| Block | Cultivar A | Cultivar B | Block mean |
| I | 120 | 70 | 95 |
| II | 130 | 90 | 110 |
| III | 110 | 50 | 80 |
| Mean: 120 Variance: 100 | Mean: 70 Variance: 400 | Mean: 95 Variance: 225 |
Then, we can calculate pooled variance for RCBD.

((3-1) * 100 + (3-1) * 400 – 2 * (3-1) * 225) / ((2-1)*(3-1)) = 50
The value is 50, and it’s the same as MSE in One-way ANOVA with block.

I searched for many websites, and I think this equation is unique as so far no one tells about pooled variance in RCBD. Therefore, I’m pleased to introduce my new equation to calculate pooled variance for RCBD.