How to use Google Colab for Python (power tool to analyze data)?
Google Colaboratory (aka. Colab) is a cloud-based platform that provides a Jupyter notebook environment and therefore users can write and run Python code. You don’t have to install Anaconda to use Jupyter notebook. If you have a google account, simply you can analyze data. Google Colab is a powerful tool for collaborative coding and data analysis, providing users with an easy-to-use platform with a wide range of features and resource.
I introduce how to set up Google Colab.
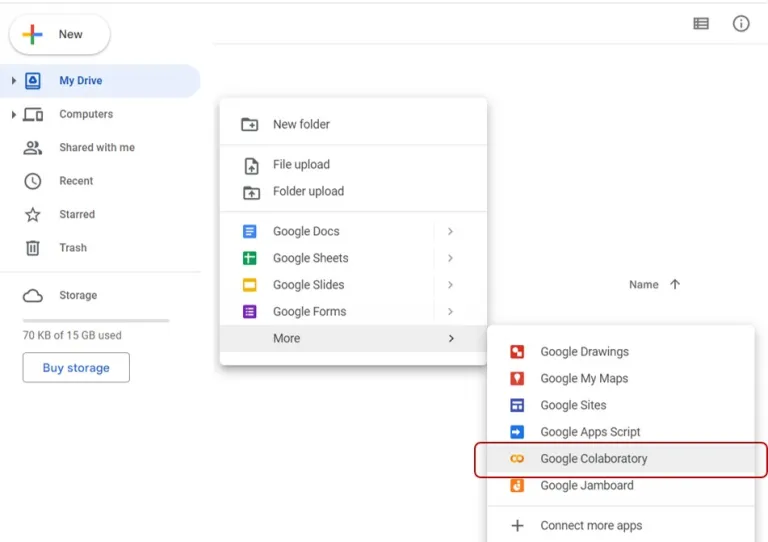
Step 1) to connect Google Colab with Google Drive
Go to your Google Drive and right click in the mouse. You can find Google Colaboratory and select.
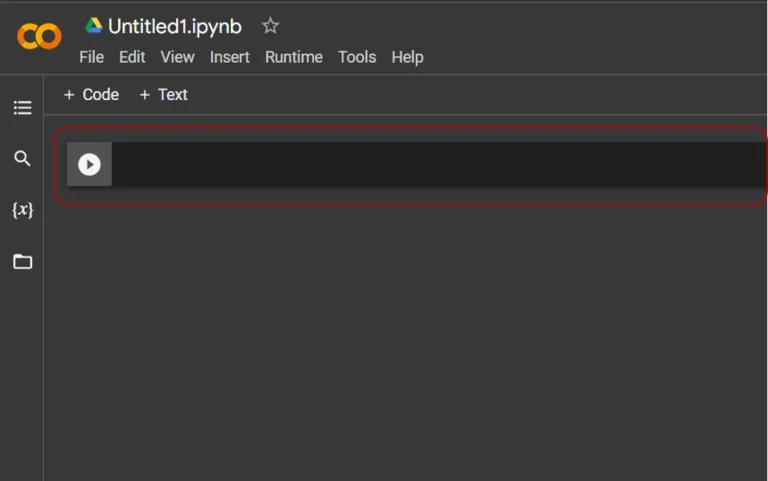
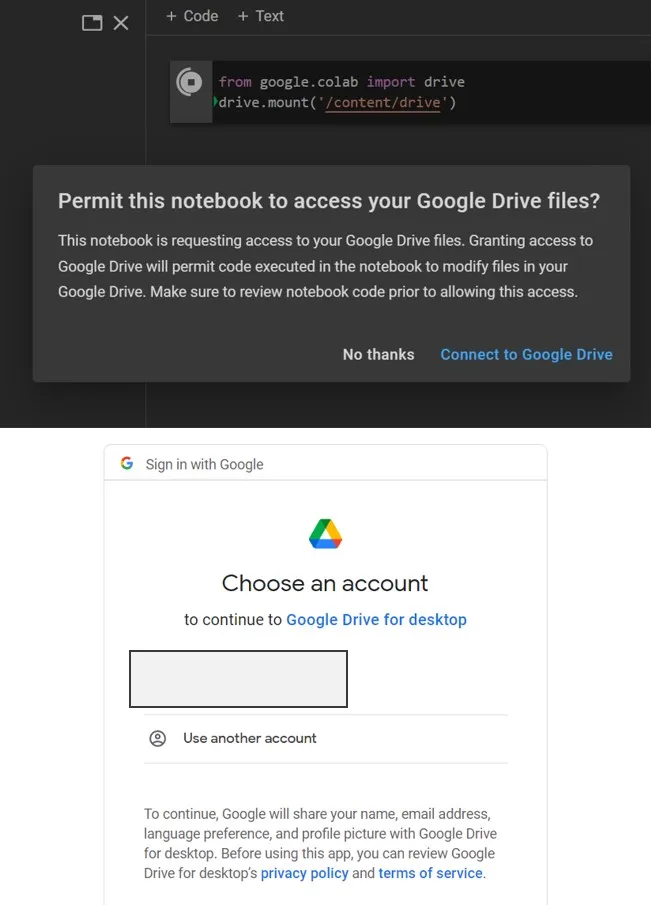
Then, a new window pops up. In the code line, enter this code.
from google.colab import drive
drive.mount('/content/drive')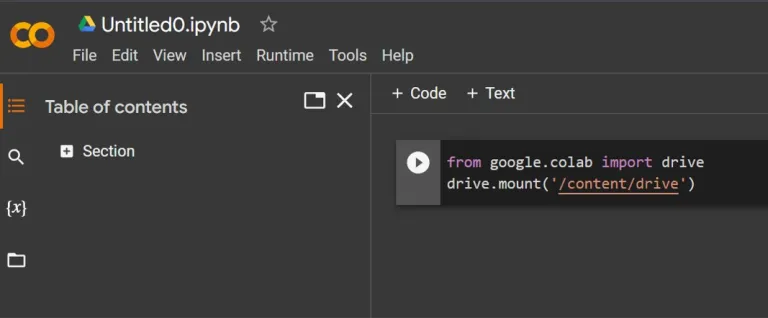
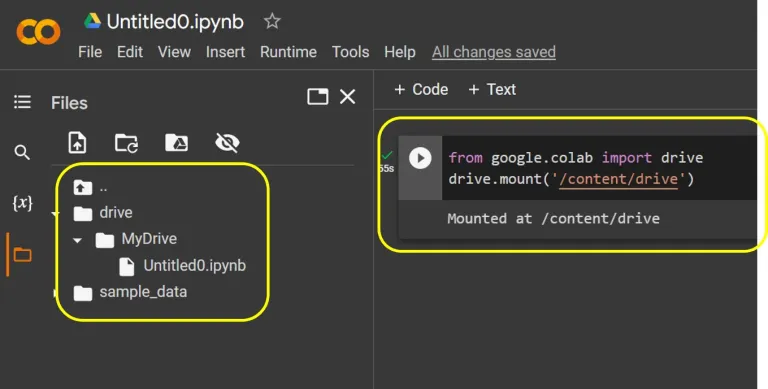
This is the process to mount Google Drive in Google Colab. Choose your google account.
You can see message, mounted at /content/drive. Now your google drive is connected to Google Colab.
Step 2) to upload data in Google Drive
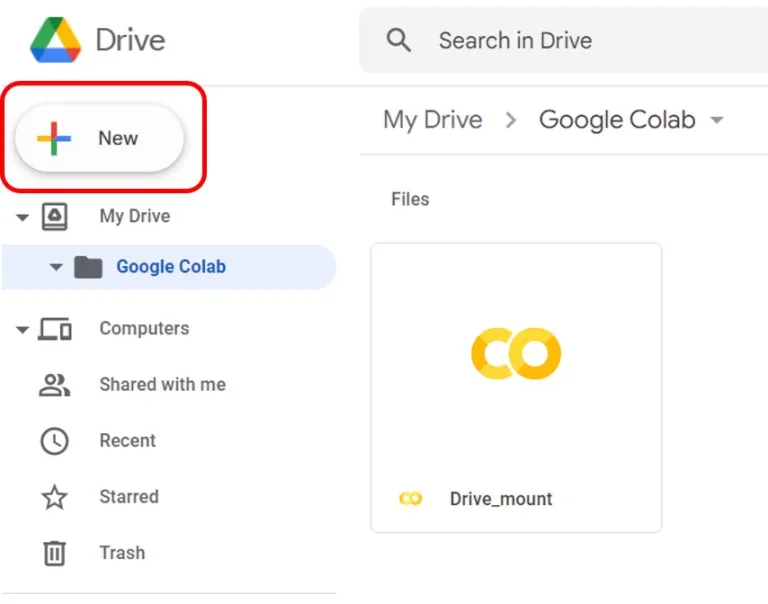
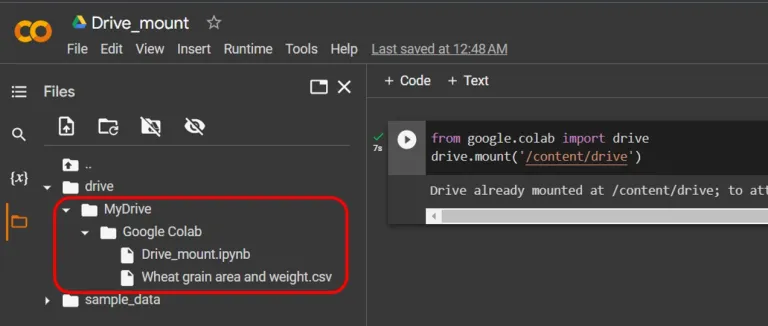
I generated folder name, ‘Google Colab’. Now I’d like to upload data in this folder.
You can download wheat grain and weight data I uploaded in Kaggle.
Download>> Wheat grain area and weight.csv
If you downloaded this data, let’s upload the data to google drive.
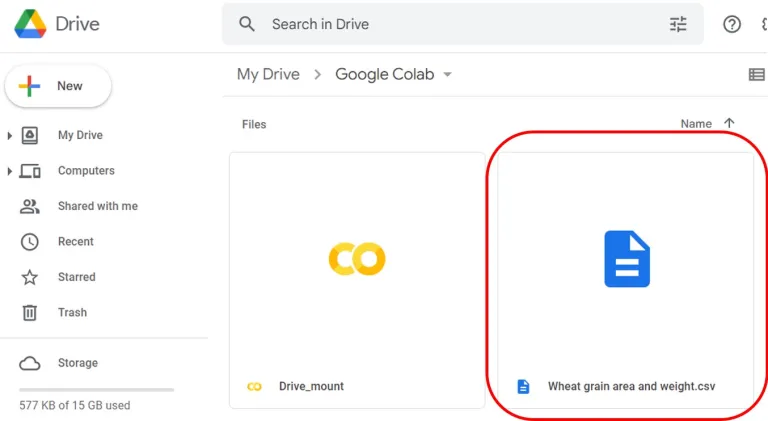
As google drive and Google Colab is connected now, if you open a Google Colab window, the data will be shown in the directory of google drive (Red box below)
Step 3) to open data in Google Colab
On the file name you want to open, right click in the mouse and select ‘Copy path’.
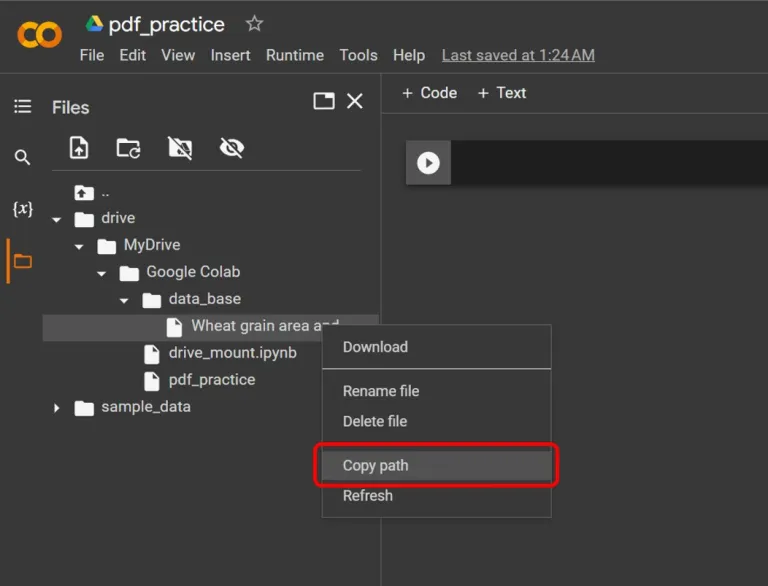
and write code like below (The code is Python based).
import pandas as pd
data=pd.read_csv("/content/drive/MyDrive/Google Colab/data_base/Wheat grain area and weight.csv")

data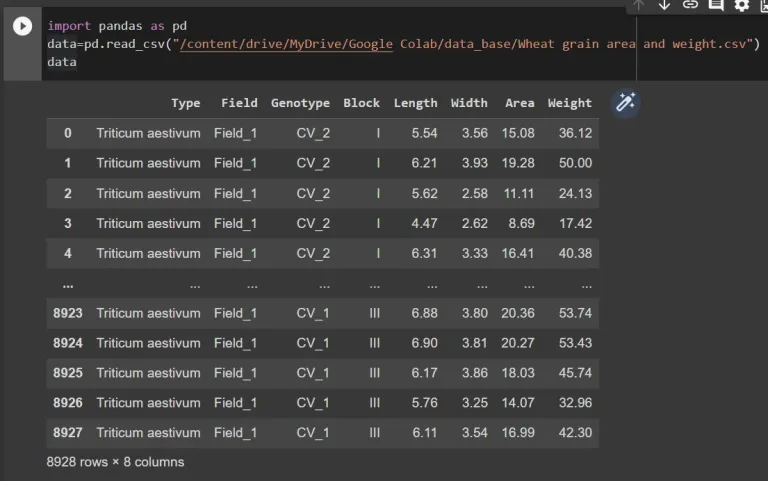
Let’s see how this data looks like.
print(data.shape)
print(data.head(15))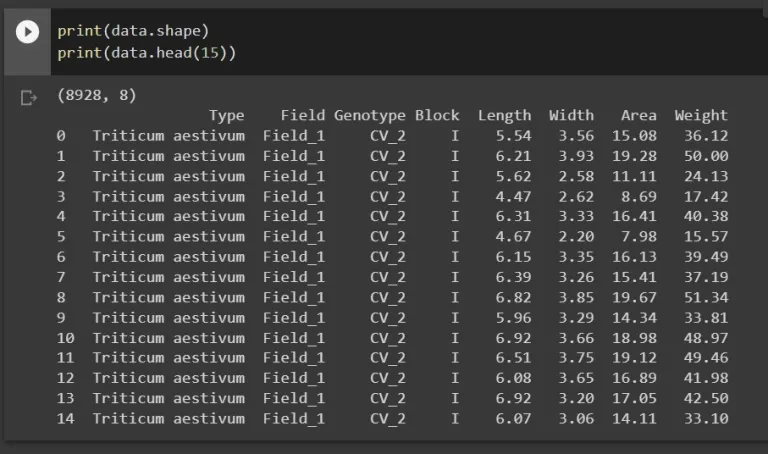
This data have 8928 rows and 8 columns. I’d like to check there are dupilcated values.
print(len(data[data.duplicated()]))
print(data[data.duplicated(keep=False)].sort_values(by=list(data.columns)))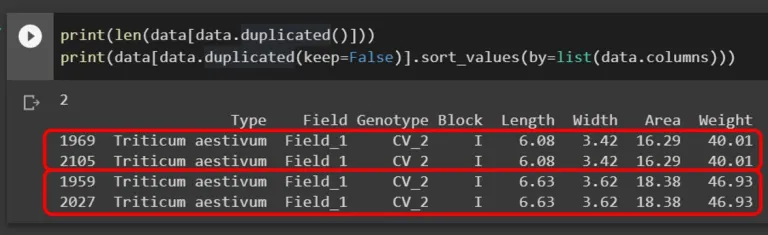
I found two values are duplicated. I’ll delete it.
data.drop_duplicates(inplace=True,)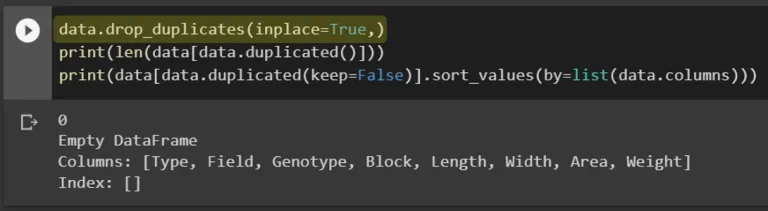
Step 4) Statistical analysis
I’ll conduct 1-Way ANOVA. I’d like to know how wheat weight is different from genotypes.
# One-Way ANOVA
import statsmodels.api as sm
from statsmodels.formula.api import ols
model = ols('Weight~C(Genotype)+ C(Block)',
        data=data).fit()
sm.stats.anova_lm(model, typ=3).round(5)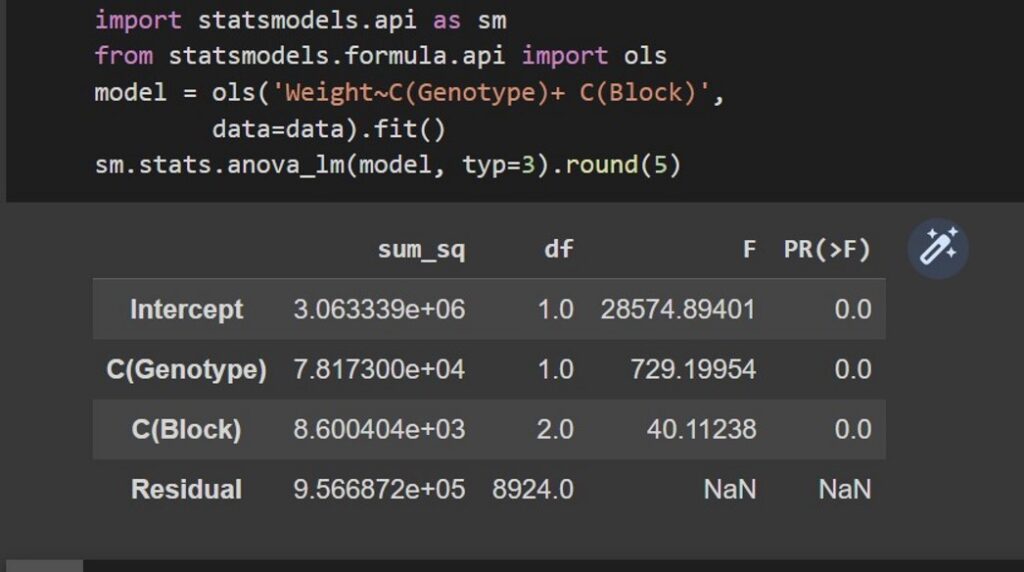
Two genotypes shows significant difference about weight.
Step 5) to draw graph
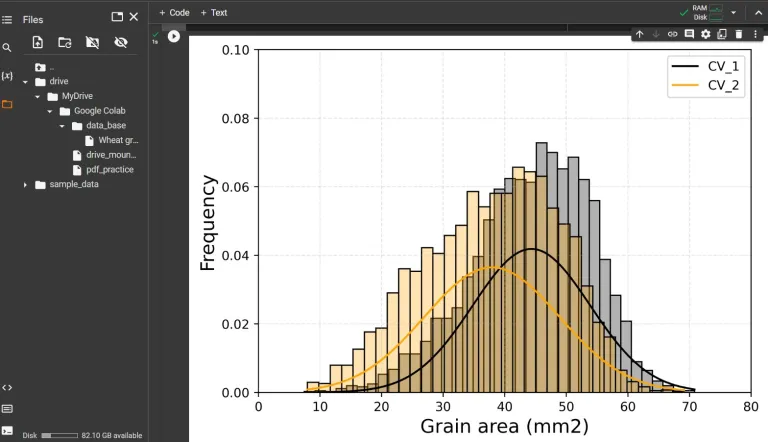
I’ll introduce how to draw a normal distribution graph with histogram. If you copy and paste the below code to your Google Colab, you can obtain the same graph (Please check the data pathway in your google drive).
# to import package
import numpy as np
import pandas as pd
import scipy.stats as stats
import matplotlib.pyplot as plt
from pylab import rcParams
import seaborn as sns

# to upload data
df=pd.read_csv("/content/drive/MyDrive/Google Colab/data_base/Wheat grain area and weight.csv")

# to split data
cv1 = df.loc[df['Genotype']=='CV_1']
cv2 = df.loc[df['Genotype']=='CV_2']

# to calculate mean and standard deviation per genotype
cv1_mean = np.mean(cv1["Weight"])
cv1_std = np.std(cv1["Weight"])
cv2_mean = np.mean(cv2["Weight"])
cv2_std = np.std(cv2["Weight"])

# to calculate PDF
cv1_pdf = stats.norm.pdf(cv1["Weight"].sort_values(), cv1_mean, cv1_std)
cv2_pdf = stats.norm.pdf(cv2["Weight"].sort_values(), cv2_mean, cv2_std)

# to draw normal distribution with histogram graph
plt.plot(cv1["Weight"].sort_values(), cv1_pdf, color="Black", label="CV_1")
plt.plot(cv2["Weight"].sort_values(), cv2_pdf, color="Orange", label="CV_2")
sns.histplot(data = cv1["Weight"], color="Black",stat = "probability",alpha=0.3)
sns.histplot(data = cv2["Weight"], color="Orange", stat = "probability",alpha=0.3)
plt.xlim([0,80])
plt.ylim([0,0.1])
plt.legend()
plt.xlabel("Grain area (mm2)", size=15)
plt.ylabel("Frequency", size=15)
plt.grid(True, alpha=0.3, linestyle="--")
plt.rcParams["figure.figsize"] = [7,5]
plt.rcParams["figure.dpi"] = 500
plt.show()
This is a power tool to analyze data because you don’t have to install any programs. Only what you need is Google account. Particularly, when you teach data/statistical programming at classess, you have to ask students to install specific programs. However, Google Colab simply provides an easy-to-use platform without any installing programs.