In R, how to adjust the unit of axis in graph?
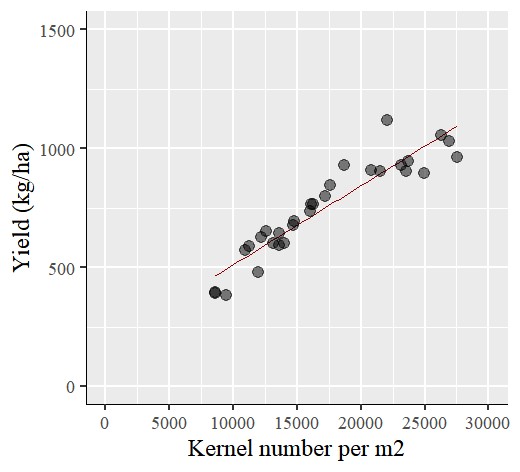
When we make graphs, the unit is great and the number would be overlapped. Here is an example.
# to upload data
library (readr)
github="https://raw.githubusercontent.com/agronomy4future/raw_data_practice/main/yield%20component_nitrogen.csv"
dataA=data.frame(read_csv(url(github),show_col_types=FALSE))

# to draw a graph
library (ggplot2)
ggplot(data=dataA, aes(x=GN, y=Yield))+
  stat_smooth(method='lm', linetype=1, se=FALSE,
              formula=y~x, linewidth=0.5, color="dark red") +
  geom_point(alpha=0.5, size=4) +
  scale_x_continuous(breaks=seq(0,30000,5000), limits=c(0,30000)) +
  scale_y_continuous(breaks=seq(0,1500,500), limits=c(0,1500))+
  labs(y="Kernel number per m2", x="Yield (kg/ha)") +
  theme_grey(base_size=18, base_family="serif")+
  theme(axis.line=element_line(linewidth=0.5, color="black"))+
  windows(width=5.5, height=5)
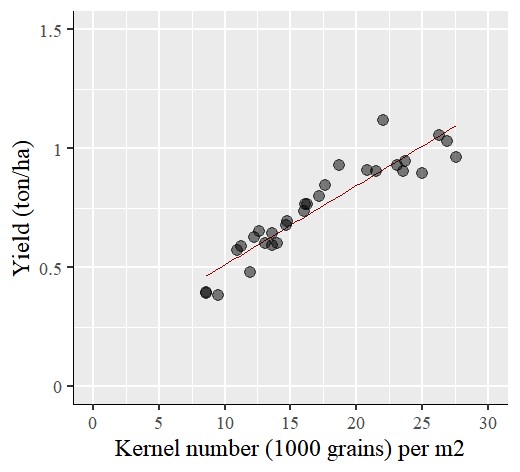
Now, I’d like to change the unit of number. For example, I want to divide each value by 1000, so that to show 5 to 30 in x-axis. We can add below codes.
ggplot(data=dataA, aes(x=GN, y=Yield))+
  stat_smooth(method='lm',linetype=1,se=FALSE,
              formula=y~x,linewidth=0.5,color="dark red") +
  geom_point(alpha=0.5,size=4) +
  scale_x_continuous(breaks=seq(0,30000,5000),limits=c(0,30000),
                     labels=function(l) {trans=l/1000}) +
  scale_y_continuous(breaks=seq(0,1500,500),limits=c(0,1500),
                     labels=function(l) {trans=l/1000})+
  labs(x="Kernel number per m2", y="Yield (kg/ha)") +
  theme_grey(base_size=18, base_family="serif")+
  theme(axis.line=element_line(linewidth=0.5, colour="black"))+
  windows(width=5.5, height=5)