A Guide to Normalizing Data for Different Treatments in R
I have data, as shown below, regarding iron contents in soil and the plant uptake of iron at different growth stages in winter wheat. I want to analyze the relationship between the iron content in the soil and the plant uptake of iron at different growth stages in winter wheat.
library(readr)
github="https://raw.githubusercontent.com/agronomy4future/raw_data_practice/main/wheat_grain_Fe_uptake.csv"
dataA= data.frame(read_csv(url(github), show_col_types= FALSE))

    Location Season Genotype Reps Iron_ton_ha      Stage   Fe
1       East   2021      CV1    1     21.7127 Vegetative 0.44
2       East   2021      CV1    2      8.7340 Vegetative 0.30
3       East   2021      CV1    3      9.5003 Vegetative 0.31
4       East   2021      CV1    4      5.9481 Vegetative 0.37
5       East   2021      CV1    5      7.4608 Vegetative 0.30
6       East   2021      CV1    6     20.5326 Vegetative 0.33
7       East   2021      CV1    7     19.8532 Vegetative 0.29
8       East   2021      CV1    8      7.9718 Vegetative 0.35
9       East   2021      CV1    9     15.0087 Vegetative 0.38
10      East   2021      CV1   10      5.6608 Vegetative 0.40
.
.
.
We can simply draw a regression graph. However, before doing that, we need to reshape the data. I’ll transpose the data from rows to columns based on the variables in the Stage column.
library(dplyr)
library(tidyr)
dataB= data.frame(dataA %>%
  group_by(Location, Season, Genotype, Iron_ton_ha, Stage) %>%
  spread(key=Stage, value = Fe))

dataB
    Location Season Genotype Iron_ton_ha Maturity Reproductive Vegetative
1       East   2021      CV1      5.6608     0.14         0.31       0.40
2       East   2021      CV1      5.9481     0.18         0.30       0.37
3       East   2021      CV1      6.2757     0.08         0.29       0.38
4       East   2021      CV1      7.4608     0.12         0.34       0.30
5       East   2021      CV1      7.5574     0.15         0.28       0.36
6       East   2021      CV1      7.8064     0.15         0.29       0.34
7       East   2021      CV1      7.9718     0.17         0.31       0.35
8       East   2021      CV1      8.0175     0.15         0.30       0.45
9       East   2021      CV1      8.2875     0.14         0.31       0.36
10      East   2021      CV1      8.6052     0.11         0.32       0.38
.
.
.
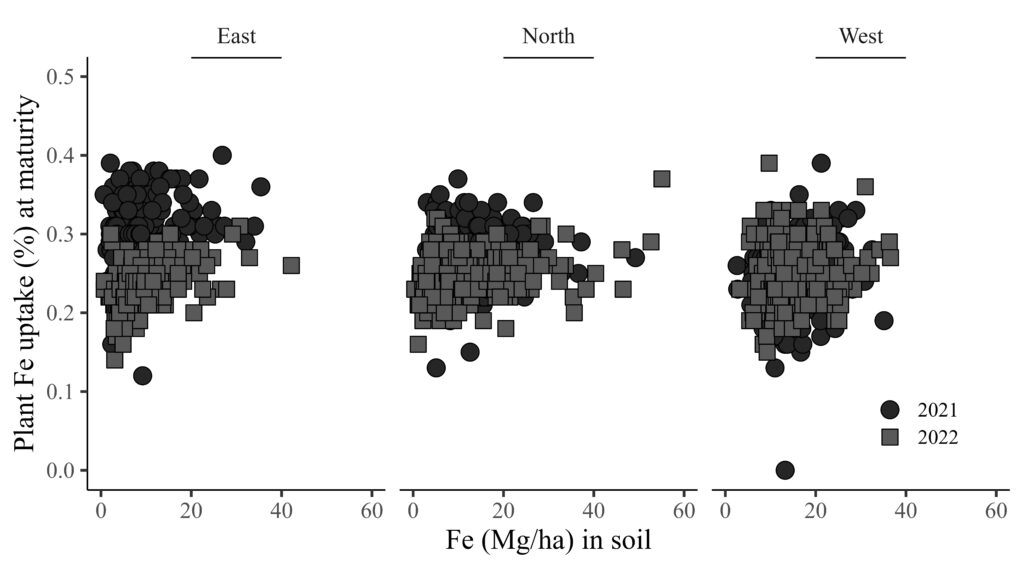
Now, I will analyze the relationship between the iron (Fe) content in the soil and the uptake of iron by plants at maturity.
library(ggplot2)
FIGA= ggplot(data=dataB, aes(x=Iron_ton_ha, y=Reproductive))+
  geom_point(aes(fill=as.factor(Season), shape=as.factor(Season)),color="black", size=5) +
  scale_fill_manual(values= c("grey15","grey35","grey55")) +
  scale_shape_manual(values= c(21,22,24)) +
  scale_x_continuous(breaks=seq(0,60,20),limits=c(0,60)) +
  scale_y_continuous(breaks=seq(0,0.5,0.1),limits=c(0,0.5)) +
  facet_wrap(~ Location) +
  annotate("segment", x=20, xend=40, y=Inf, yend=Inf, color="black",lwd=1)+
  labs(x="Fe (Mg/ha) in soil", y="Plant Fe uptake (%) at maturity") +
  theme_classic(base_size=18, base_family="serif") +
  theme(legend.position=c(0.90,0.17),
        legend.title=element_blank(),
        legend.key=element_rect(color="white", fill="white"),
        legend.text=element_text(family="serif", face="plain", size=13, color="black"),
        legend.background= element_rect(fill="white"),
        strip.background=element_rect(color="white", linewidth=0.5, linetype="solid"),
        axis.line = element_line(linewidth = 0.5, colour="black"))
FIGA + windows(width=9, height=5)
ggsave("C:/Users/dream/Desktop/R_OUTPUT/FIGA.jpg",
       FIGA, width=9*2.54, height=5*2.54, units="cm", dpi=1000)
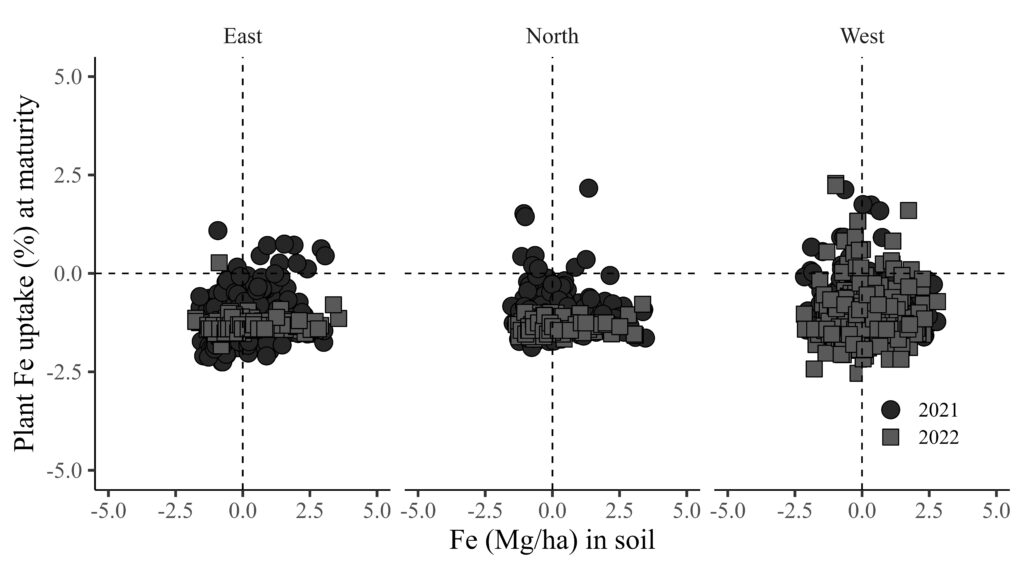
Now, I’ll normalize the data for each treatment combination (i.e., East, 2021, CV1) using the mutate() function. For easier normalization calculations, a vertically organized data format is preferable. Therefore, I’ll be using the dataA dataset.
dataC= data.frame(dataA %>%
       group_by(Location, Season, Genotype) %>%
       mutate(
              Normalized_Fe_plant=(Fe-mean(Fe))/sd(Fe),
              Normalized_Fe_soil=(Iron_ton_ha-mean(Iron_ton_ha))/sd(Iron_ton_ha)
              ))

dataC
    Location Season Genotype Reps Iron_ton_ha      Stage   Fe Normalized_Fe_plant Normalized_Fe_soil
1       East   2021      CV1    1     21.7127 Vegetative 0.44         1.682394399         1.85849093
2       East   2021      CV1    2      8.7340 Vegetative 0.30         0.246204058        -0.48486395
3       East   2021      CV1    3      9.5003 Vegetative 0.31         0.348789083        -0.34650550
4       East   2021      CV1    4      5.9481 Vegetative 0.37         0.964299229        -0.98786906
5       East   2021      CV1    5      7.4608 Vegetative 0.30         0.246204058        -0.71474518
Then, let’s reshape the data from row to column regarding the Stage.
library(dplyr)
library(tidyr)
dataD= data.frame(dataC %>%
                    group_by(Location, Season, Genotype, Normalized_Fe_soil, Stage) %>%
                    spread(key=Stage, value= Normalized_Fe_plant))

dataD
    Location Season Genotype Normalized_Fe_soil    Maturity Reproductive   Vegetative
1       East   2021      CV1        -1.03974219 -1.39515633  0.348789083  1.272054302
2       East   2021      CV1        -0.98786906 -0.98481623  0.246204058  0.964299229
3       East   2021      CV1        -0.92871960 -2.01066648  0.143619034  1.066884253
4       East   2021      CV1        -0.71474518 -1.60032638  0.656544156  0.246204058
5       East   2021      CV1        -0.69730367 -1.29257131  0.041034010  0.861714204
Let’s draw the graph again.
library(ggplot2)
FIGB= ggplot(data=dataD, aes(x=Normalized_Fe_soil, y=Maturity))+
  geom_point(aes(fill=as.factor(Season), shape=as.factor(Season)),color="black", size=5) +
  scale_fill_manual(values= c("grey15","grey35","grey55")) +
  scale_shape_manual(values= c(21,22,24)) +
  scale_x_continuous(breaks=seq(-5,5,2.5),limits=c(-5,5)) +
  scale_y_continuous(breaks=seq(-5,5,2.5),limits=c(-5,5)) +
  geom_vline(xintercept=0, linetype="dashed", color="black") +
  geom_hline(yintercept=0, linetype="dashed", color= "black") +
  facet_wrap(~ Location) +
  annotate("segment", x=20, xend=40, y=Inf, yend=Inf, color="black",lwd=1)+
  labs(x="Fe (Mg/ha) in soil", y="Plant Fe uptake (%) at maturity") +
  theme_classic(base_size=18, base_family="serif") +
  theme(legend.position=c(0.90,0.17),
        legend.title=element_blank(),
        legend.key=element_rect(color="white", fill="white"),
        legend.text=element_text(family="serif", face="plain", size=13, color="black"),
        legend.background= element_rect(fill="white"),
        strip.background=element_rect(color="white", linewidth=0.5, linetype="solid"),
        axis.line = element_line(linewidth = 0.5, colour="black"))
FIGB + windows(width=9, height=5)
ggsave("C:/Users/dream/Desktop/R_OUTPUT/FIGB.jpg",
       FIGB, width=9*2.54, height=5*2.54, units="cm", dpi=1000)
### full code
https://github.com/agronomy4future/r_code/blob/main/data_normalization

library(readr)
library(dplyr)
library(tidyr)
library(ggplot2)

#data upload
github="https://raw.githubusercontent.com/agronomy4future/raw_data_practice/main/wheat_Fe_uptake.csv"
dataA= data.frame(read_csv(url(github), show_col_types= FALSE))

# data normalization
dataB= data.frame(dataA %>%
                  group_by(Location, Season, Genotype) %>%
                  mutate(
                  Normalized_Fe_plant=(Fe-mean(Fe))/sd(Fe),
                  Normalized_Fe_soil=(Iron_ton_ha-mean(Iron_ton_ha))/sd(Iron_ton_ha)
                    ))

# data reshape
dataC= data.frame(dataB %>%
                  group_by(Location, Season, Genotype, Normalized_Fe_soil, Stage) %>%
                  spread(key=Stage, value= Normalized_Fe_plant))

# graph
FIGB= ggplot(data=dataC, aes(x=Normalized_Fe_soil, y=Maturity))+
  geom_point(aes(fill=as.factor(Season), shape=as.factor(Season)),color="black", size=5) +
  scale_fill_manual(values= c("grey15","grey35","grey55")) +
  scale_shape_manual(values= c(21,22,24)) +
  scale_x_continuous(breaks=seq(-5,5,2.5),limits=c(-5,5)) +
  scale_y_continuous(breaks=seq(-5,5,2.5),limits=c(-5,5)) +
  geom_vline(xintercept=0, linetype="dashed", color="black") +
  geom_hline(yintercept=0, linetype="dashed", color= "black") +
  facet_wrap(~ Location) +
  annotate("segment", x=20, xend=40, y=Inf, yend=Inf, color="black",lwd=1)+
  labs(x="Fe (Mg/ha) in soil", y="Plant Fe uptake (%) at maturity") +
  theme_classic(base_size=18, base_family="serif") +
  theme(legend.position=c(0.90,0.17),
        legend.title=element_blank(),
        legend.key=element_rect(color="white", fill="white"),
        legend.text=element_text(family="serif", face="plain", size=13, color="black"),
        legend.background= element_rect(fill="white"),
        strip.background=element_rect(color="white", linewidth=0.5, linetype="solid"),
        axis.line = element_line(linewidth = 0.5, colour="black"))
FIGB + windows(width=9, height=5)
Is R calculation correct?
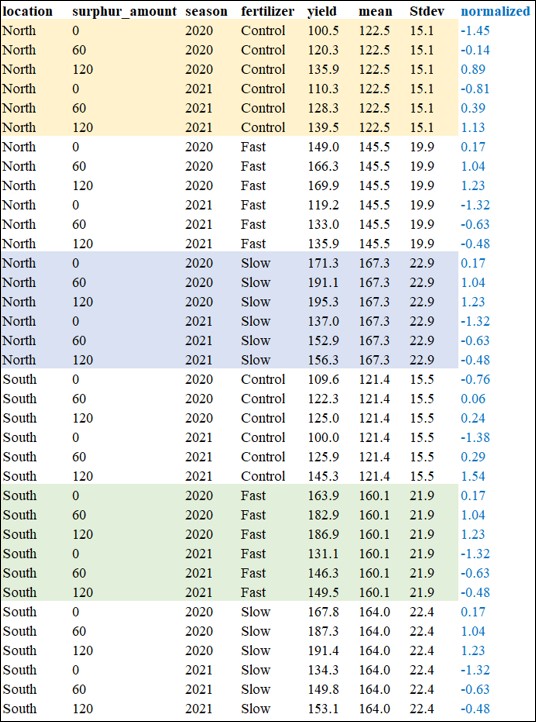
I have just used the code and now I’m wondering whether the code I used correctly calculates normalization. Therefore, I will manually calculate normalization and compare the values.

I pooled data from two seasons and normalized yield based on location and fertilizer. Now, I’ll check whether this normalized data matches what R calculated.
library(readr)
github="https://raw.githubusercontent.com/agronomy4future/raw_data_practice/main/normalization_practice.csv"
dataA= data.frame(read_csv(url(github), show_col_types= FALSE))

dataB= data.frame(dataA %>%
                    group_by(location, fertilizer) %>%
                    mutate(
                      Normalized_R=(normalized-mean(normalized))/sd(normalized),
                    ))

dataB$Normalized_R=round(dataB$Normalized_R,digits=2)

dataB
   location surphur_amount season fertilizer yield  mean Stdev normalized Normalized_R
1     North              0   2020    Control 100.5 122.5  15.1      -1.45        -1.45
2     North             60   2020    Control 120.3 122.5  15.1      -0.14        -0.14
3     North            120   2020    Control 135.9 122.5  15.1       0.89         0.89
4     North              0   2021    Control 110.3 122.5  15.1      -0.81        -0.81
5     North             60   2021    Control 128.3 122.5  15.1       0.39         0.39
6     North            120   2021    Control 139.5 122.5  15.1       1.13         1.13
7     North              0   2020       Fast 149.0 145.5  19.9       0.17         0.17
8     North             60   2020       Fast 166.3 145.5  19.9       1.04         1.04
9     North            120   2020       Fast 169.9 145.5  19.9       1.23         1.23
10    North              0   2021       Fast 119.2 145.5  19.9      -1.32        -1.32
11    North             60   2021       Fast 133.0 145.5  19.9      -0.63        -0.63
12    North            120   2021       Fast 135.9 145.5  19.9      -0.48        -0.48
13    North              0   2020       Slow 171.3 167.3  22.9       0.17         0.17
14    North             60   2020       Slow 191.1 167.3  22.9       1.04         1.04
15    North            120   2020       Slow 195.3 167.3  22.9       1.23         1.23
16    North              0   2021       Slow 137.0 167.3  22.9      -1.32        -1.32
17    North             60   2021       Slow 152.9 167.3  22.9      -0.63        -0.63
18    North            120   2021       Slow 156.3 167.3  22.9      -0.48        -0.48
19    South              0   2020    Control 109.6 121.4  15.5      -0.76        -0.76
20    South             60   2020    Control 122.3 121.4  15.5       0.06         0.06
21    South            120   2020    Control 125.0 121.4  15.5       0.24         0.24
22    South              0   2021    Control 100.0 121.4  15.5      -1.38        -1.38
23    South             60   2021    Control 125.9 121.4  15.5       0.29         0.29
24    South            120   2021    Control 145.3 121.4  15.5       1.54         1.54
25    South              0   2020       Fast 163.9 160.1  21.9       0.17         0.17
26    South             60   2020       Fast 182.9 160.1  21.9       1.04         1.04
27    South            120   2020       Fast 186.9 160.1  21.9       1.23         1.23
28    South              0   2021       Fast 131.1 160.1  21.9      -1.32        -1.32
29    South             60   2021       Fast 146.3 160.1  21.9      -0.63        -0.63
30    South            120   2021       Fast 149.5 160.1  21.9      -0.48        -0.48
31    South              0   2020       Slow 167.8 164.0  22.4       0.17         0.17
32    South             60   2020       Slow 187.3 164.0  22.4       1.04         1.04
33    South            120   2020       Slow 191.4 164.0  22.4       1.23         1.23
34    South              0   2021       Slow 134.3 164.0  22.4      -1.32        -1.32
35    South             60   2021       Slow 149.8 164.0  22.4      -0.63        -0.63
36    South            120   2021       Slow 153.1 164.0  22.4      -0.48        -0.48
My calculation matches the R calculation, so I can trust the code.
