Customizing R Graphs: Splitting Text into Two Rows
I have a dataset as below.
treatment=rep(c("Cultivar A","Cultivar B","Cultivar C","Cultivar D","Cultivar E"), each=3)
rep=rep(c("I","II","III"), time=5)
yield=c(10,11,21,13,23,23,13,13,5,33,21,13,42,12,13)
dataA=data.frame(treatment,rep, yield)

dataA
    treatment rep yield
1  Cultivar A   I    10
2  Cultivar A  II    11
3  Cultivar A III    21
4  Cultivar B   I    13
5  Cultivar B  II    23
6  Cultivar B III    23
7  Cultivar C   I    13
8  Cultivar C  II    13
9  Cultivar C III     5
10 Cultivar D   I    33
11 Cultivar D  II    21
12 Cultivar D III    13
13 Cultivar E   I    42
14 Cultivar E  II    12
15 Cultivar E III    13
Now, I want to create a bar graph about this data. First, let’s summarize the data.
summary=data.frame(dataA %>%
                   group_by(treatment) %>%
                   dplyr::summarize(across(c(yield),
                     .fns= list(Mean=~mean(., na.rm= TRUE),
                       SD= ~sd(., na.rm= TRUE),
                        n=~length(.),
                       se=~sd(.,na.rm= TRUE) / sqrt(length(.))))))%>%
ungroup()

summary
   treatment yield_Mean  yield_SD yield_n yield_se
1 Cultivar A   14.00000  6.082763       3 3.511885
2 Cultivar B   19.66667  5.773503       3 3.333333
3 Cultivar C   10.33333  4.618802       3 2.666667
4 Cultivar D   22.33333 10.066446       3 5.811865
5 Cultivar E   22.33333 17.039171       3 9.837570
Then, let’s create a bar graph.
library (ggplot2)
ggplot(data=summary, aes(x=treatment, y=yield_Mean)) +
  geom_bar(stat="identity",position="dodge", width=0.7, size=1, fill="grey50", color="grey15") +
  geom_errorbar(aes(ymin=yield_Mean-yield_se, ymax=yield_Mean+yield_se),
                position=position_dodge(0.9), width=0.5) +
  scale_y_continuous(breaks=seq(0,50,10), limits=c(0,50)) +
  labs(x="Cultivar", y="Yield") +
  theme_classic(base_size=18, base_family="serif") +
  theme(axis.line=element_line(linewidth=0.5, colour="black")) +
  windows(width=5.5, height=5)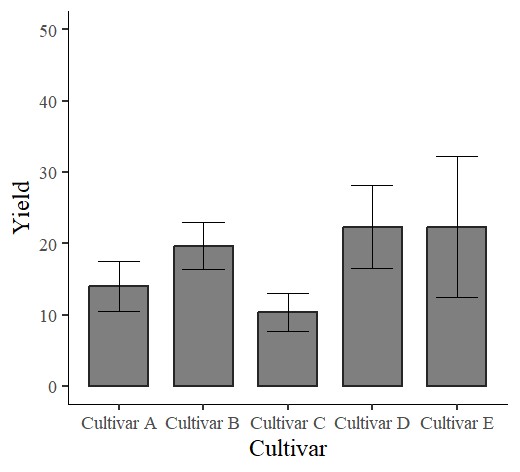
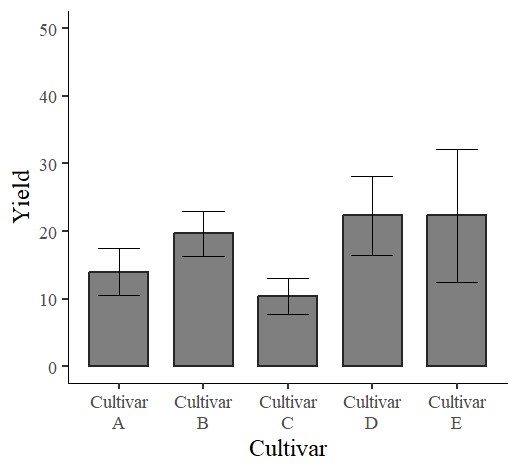
Now, to save space, I’d like to split the x-axis text into two rows using the following code.
summary$treatment= as.factor(summary$treatment)
levels(summary$treatment)= gsub(" ", "\n", levels(summary$treatment))
When you run the same code to create a bar graph, the resulting graph is shown below.
Code summary
https://github.com/agronomy4future/r_code/blob/main/Customizing_R_Graphs_Splitting_Text_into_Two_Rows.ipynb
© 2022 – 2023 https://agronomy4future.com