Exploring Machine Learning Fundamentals: Predicting Survival on the Titanic

In 2024, one of my goals is to learn machine learning and publish a crop physiology paper in an academic journal using machine learning. While taking online or offline courses of machine learning, I discovered Kaggle, a popular platform for data science and machine learning competitions, datasets, and tutorials. Kaggle provides excellent datasets for practicing basic machine learning and data analysis.
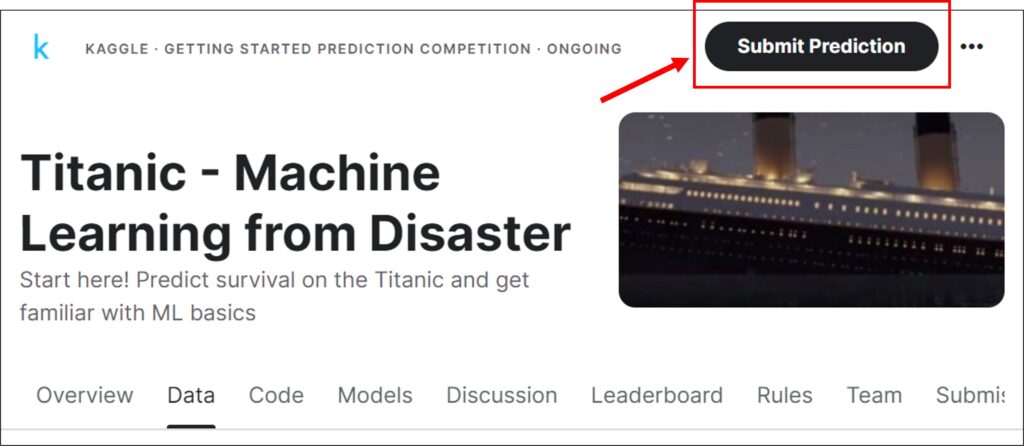
If you visit the Kaggle website: Titanic – Machine Learning from Disaster, you can access and download various datasets. To download data from Kaggle, you’ll need to create a Kaggle account. Signing up for Kaggle is easy, but you may not always need an account. If you’re interested, I can share a method for importing Kaggle datasets directly into Google Colab. Please check out the post below for more details!
□ How to import Kaggle datasets directly into Google Colab?
□ How to use Google Colab for Python (power tool to analyze data)?
The code I explained in the post is based on Python, and Google Colab is an excellent Python-friendly environment. If you’re interested in learning how to use Google Colab, please refer to the post above for detailed instructions.
#to mount Google Drive on Google Colab
from google.colab import drive
drive.mount('/content/drive')

# JSON file download
! mkdir -p ~/.kaggle
! cp /content/drive/MyDrive/Colab/0_archive/kaggle.json ~/.kaggle
! chmod 600 ~/.kaggle/kaggle.json

# to download dataset from Kaggle
!kaggle competitions download -c titanic -p "/content/drive/MyDrive/Colab/3_machine_learning/Practice/Titanic_Machine_Learning_from_Disaster"
# Please check the file pathway in your Google Colab

# path to the directory containing the zip file
import zipfile
import os
titanic= "/content/drive/MyDrive/Colab/3_machine_learning/Practice/Titanic_Machine_Learning_from_Disaster/titanic.zip"
# Please check the file pathway in your Google Colab

# Path to the directory where you want to extract the contents
titanic_path = "/content/drive/MyDrive/Colab/3_machine_learning/Practice/Titanic_Machine_Learning_from_Disaster"
# Please check the file pathway in your Google Colab

# Unzip the file
with zipfile.ZipFile(titanic, 'r') as zip_ref:
    zip_ref.extractall(titanic_path)

# List the contents of the extracted directory
extracted_titanic = os.listdir(titanic_path)
print("Extracted files:", extracted_titanic)
If you run the above code in your Google Colab, you’ll be able to save the data to your Google Drive. Of course, using this code is optional; alternatively, you can download the data from Kaggle and manually save it to your Google Drive. Either way, when completing to download data, let’s start machine learning process step by step.
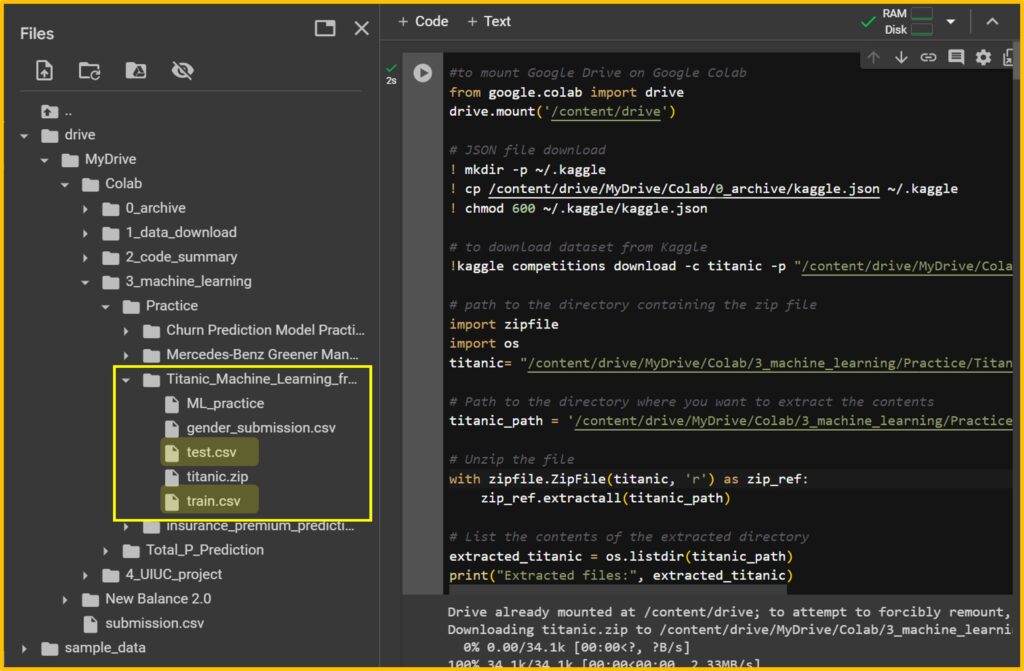
1) Data upload
First, I’ll upload data to Google Colab. The data are saved as train.csv and test.csv in the file folder;
/content/drive/MyDrive/Colab/3_machine_learning/Practice/Titanic_Machine_Learning_from_Disaster
So, I’ll create data name; train and test using pandas.
import pandas as pd
import numpy as np

train=pd.read_csv("/content/drive/MyDrive/Colab/3_machine_learning/Practice/Titanic_Machine_Learning_from_Disaster/train.csv")

test=pd.read_csv("/content/drive/MyDrive/Colab/3_machine_learning/Practice/Titanic_Machine_Learning_from_Disaster/test.csv")
Let’s check the data info.
train.info()
test.info()
<class 'pandas.core.frame.DataFrame'>
RangeIndex: 891 entries, 0 to 890
Data columns (total 12 columns):
# Column Non-Null Count Dtype
--- ------ -------------- -----
0 PassengerId 891 non-null int64
1 Survived 891 non-null int64
2 Pclass 891 non-null int64
3 Name 891 non-null object
4 Sex 891 non-null object
5 Age 714 non-null float64
6 SibSp 891 non-null int64
7 Parch 891 non-null int64
8 Ticket 891 non-null object
9 Fare 891 non-null float64
10 Cabin 204 non-null object
11 Embarked 889 non-null object
dtypes: float64(2), int64(5), object(5)
memory usage: 83.7+ KB
<class 'pandas.core.frame.DataFrame'>
RangeIndex: 418 entries, 0 to 417
Data columns (total 11 columns):
# Column Non-Null Count Dtype
--- ------ -------------- -----
0 PassengerId 418 non-null int64
1 Pclass 418 non-null int64
2 Name 418 non-null object
3 Sex 418 non-null object
4 Age 332 non-null float64
5 SibSp 418 non-null int64
6 Parch 418 non-null int64
7 Ticket 418 non-null object
8 Fare 417 non-null float64
9 Cabin 91 non-null object
10 Embarked 418 non-null object
dtypes: float64(2), int64(4), object(5)
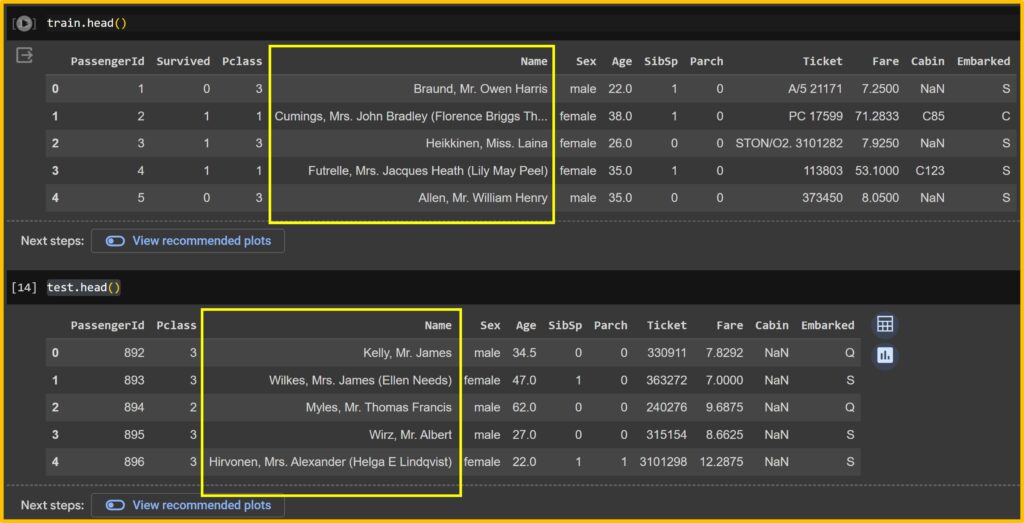
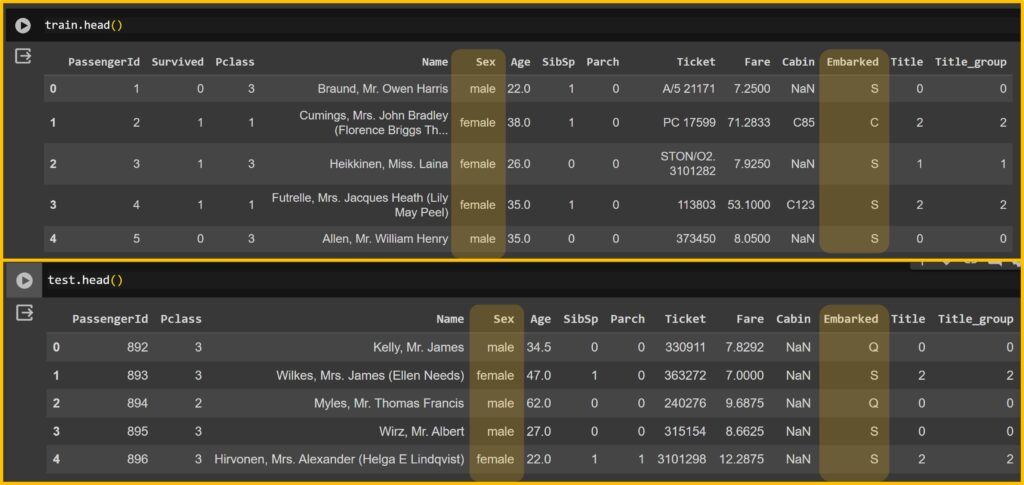
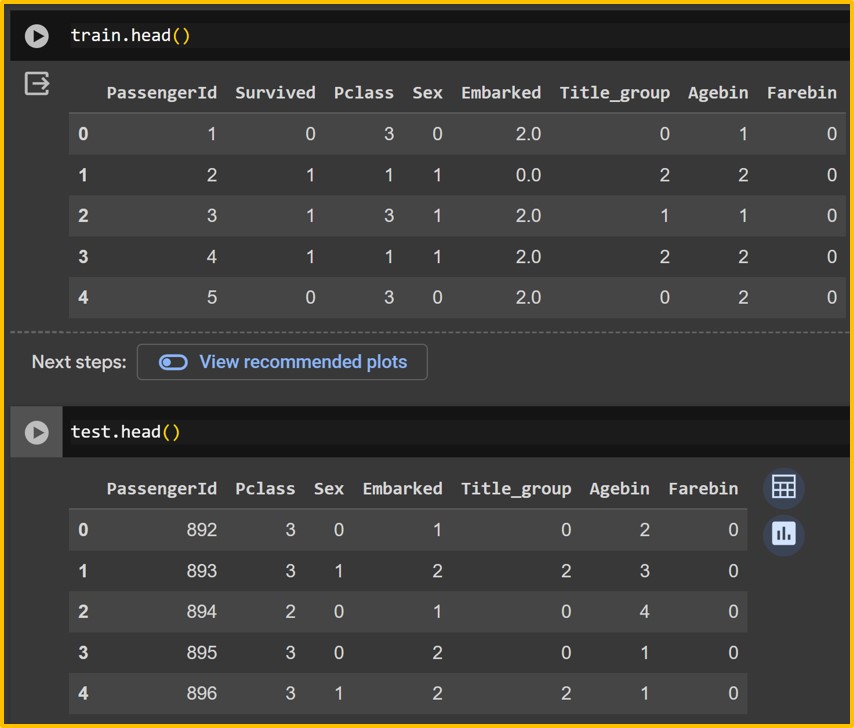
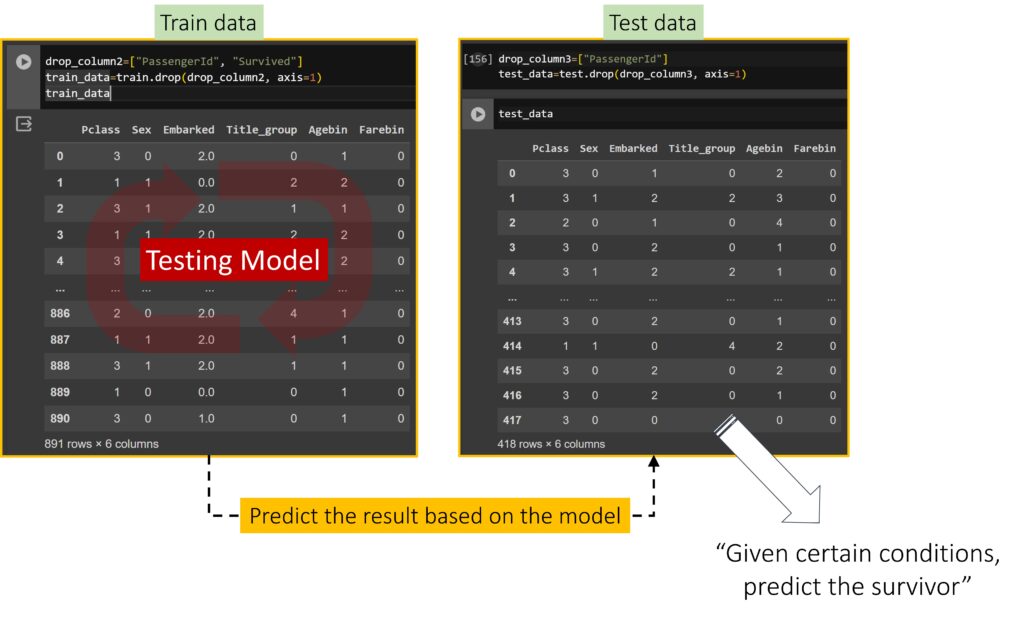
memory usage: 36.0+ KBIn the train data, you can find the ‘Survived’ column, while in the test data, it does not exist. This is because we will create our own model to predict survival on the Titanic using various variables (i.e., Pclass, Sex, Age, etc.) in the train data, and then apply our model to the test data to verify its accuracy. Of course, in the test data, the actual survival status per PassengerId exists, but it is hidden from us. When we submit our predictions, Kaggle will evaluate the accuracy of our model.
Let’s see how this data are organized.
train.head()
test.head()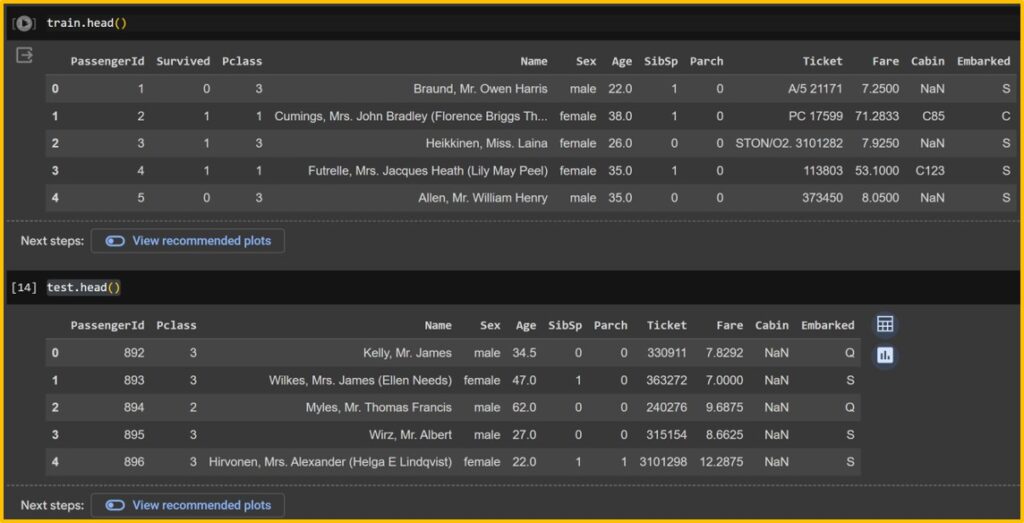
2) Null data
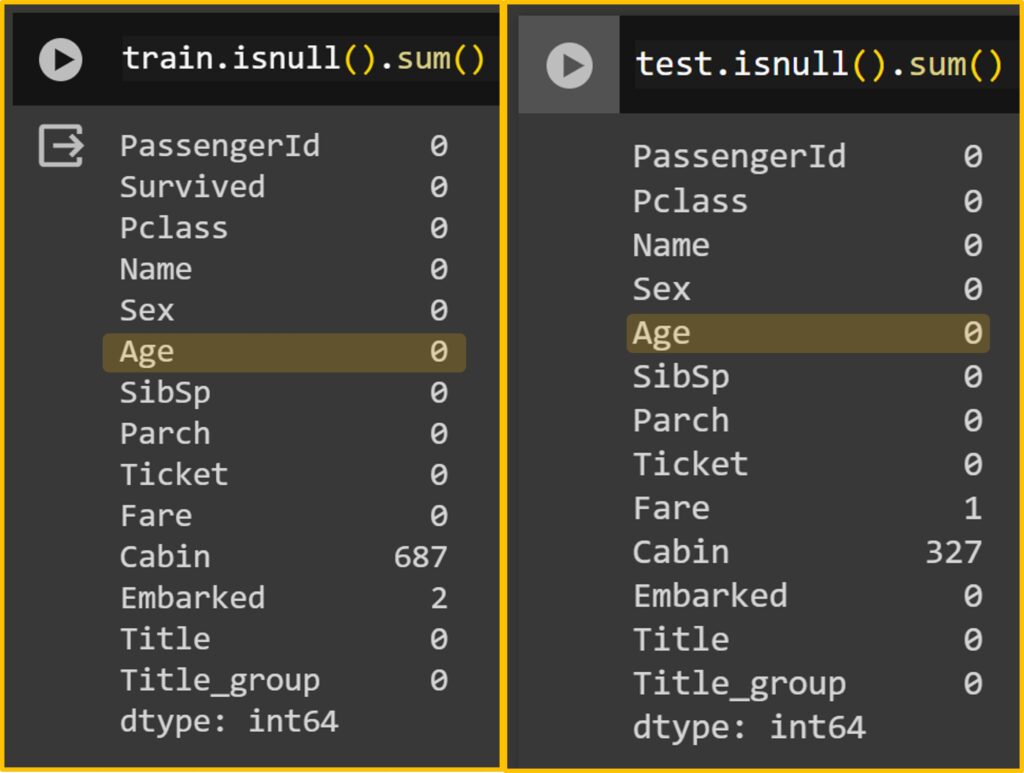
Ensuring there are no null values in your dataset is crucial as they can distort predictions. Therefore, the first step is to check whether there are any null values present.
train.isnull().sum()
test.isnull().sum()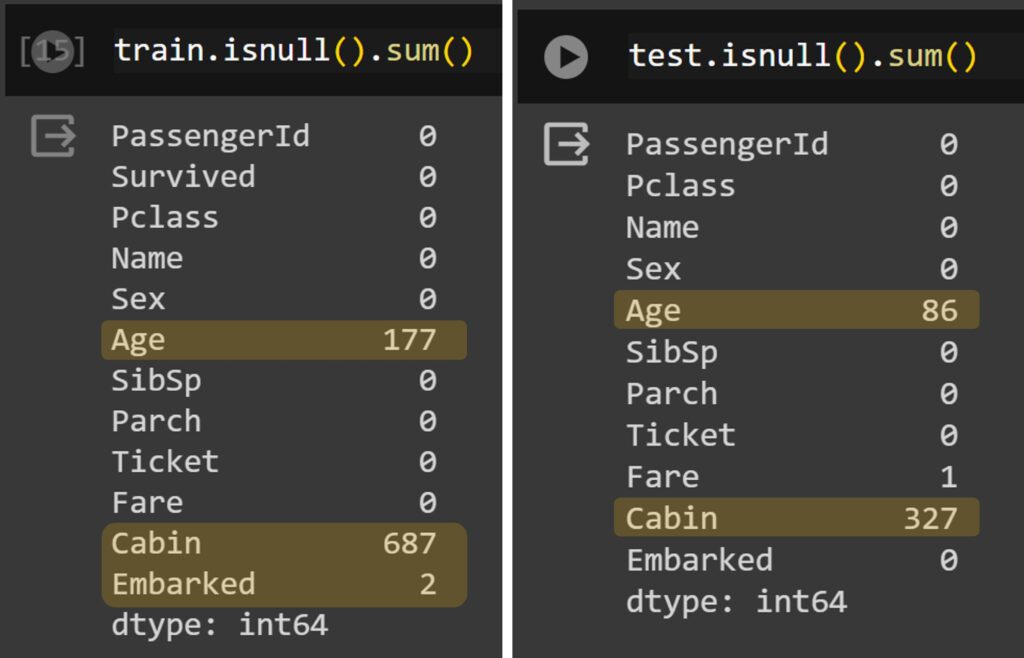
While deleting null values is a simple approach, it may distort the final results. There are various methods available to estimate null values. Personally, I prefer using the median value of specific groups.
This would be the first step in developing your own model. For example, to substitute the null value with the median value of a group, which group should we choose? If we choose ‘Sex’ as a grouping factor, it would result in a large estimation because we would use the median value of all men or women. What I see as a better grouping method is using the Title in the name, such as ‘Mr.’ or ‘Miss’, as the median age of ‘Mr.’ or ‘Miss’ would provide a more accurate estimate of age. Therefore, I’ll use the title as a grouping factor to estimate age.
3) to fill blanks
First, I’ll set up train_test data which contains references to both the train and test data.
# to make a list containing references to the train and test
train_test=[train, test]
Then, I’ll extract titles.
for dataset in train_test: dataset["Title"]= dataset["Name"].str.extract("([\w]+)\.", expand=False)Let’s see how many different titles in the train and test data.
train['Title'].value_counts()
test['Title'].value_counts()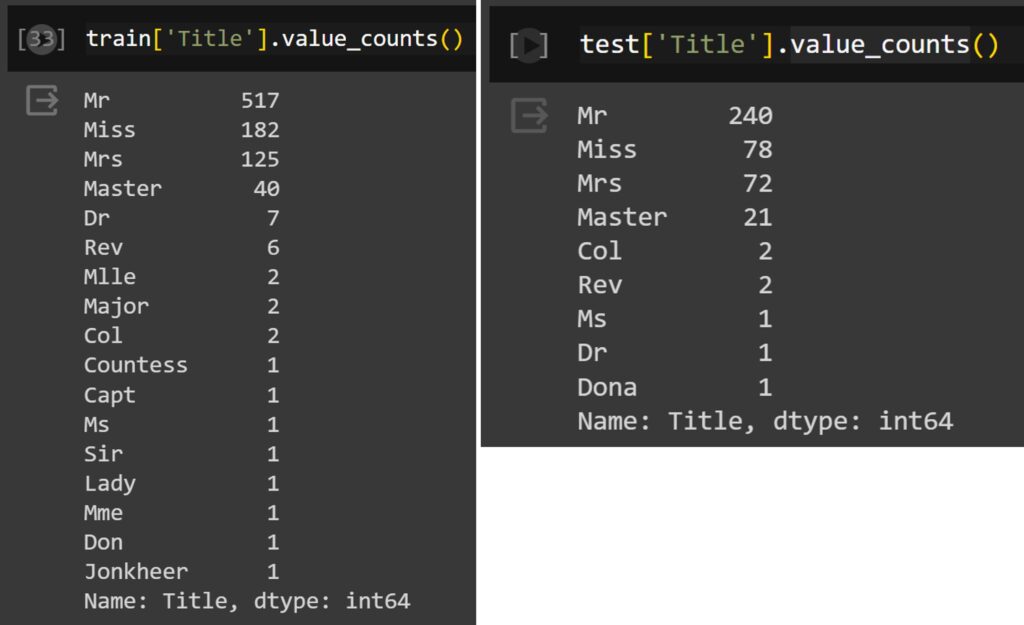
Now, we need to convert these categorical values into numerical values since computers recognize numbers but not text. Therefore, I’ll use the following code:
Title_mapping= {"Mr": 0, "Miss":1, "Mrs":2, "Master":3, "Dr":4, "Rev":5,"Mlle":6, "Major":7, "Col":8,"Countess":9, "Capt":10, "Ms":11, "Sir":11, "Lady":12, "Mme":13, "Don":14, "Jonkheer":15, "Dona":16, "Dr":17}
for dataset in train_test:
    dataset["Title"]=dataset["Title"].map(Title_mapping)
Let’s check all values were converted.
train["Title"].unique()
test["Title"].unique()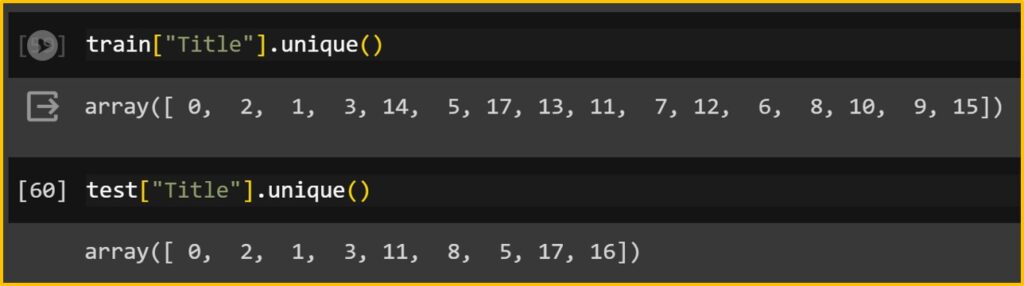
However, here is one problem. There are so many different titles. If we have another dataset, and the dataset has the title; “president”, This code will generate an error as this code does not include “president”. Therefore, we can choose the popular title and the others.
For example, if I run the following code, I’ll set up ‘Mr’, ‘Miss’, ‘Mrs’, and ‘Master’ as 1, 2, 3, and 4, respectively, and assign the others as 4. So, if we have another data, having “president” title, the president will be assigned as 4.
for dataset in train_test: dataset["Title_group"]= dataset["Name"].str.extract("([\w]+)\.", expand=False)
for dataset in train_test:
dataset['Title_group'] = dataset['Title_group'].apply(lambda x: 0 if x=="Mr" else 1 if x=="Miss" else 2 if x=="Mrs" else 3 if x=="Master" else 4)
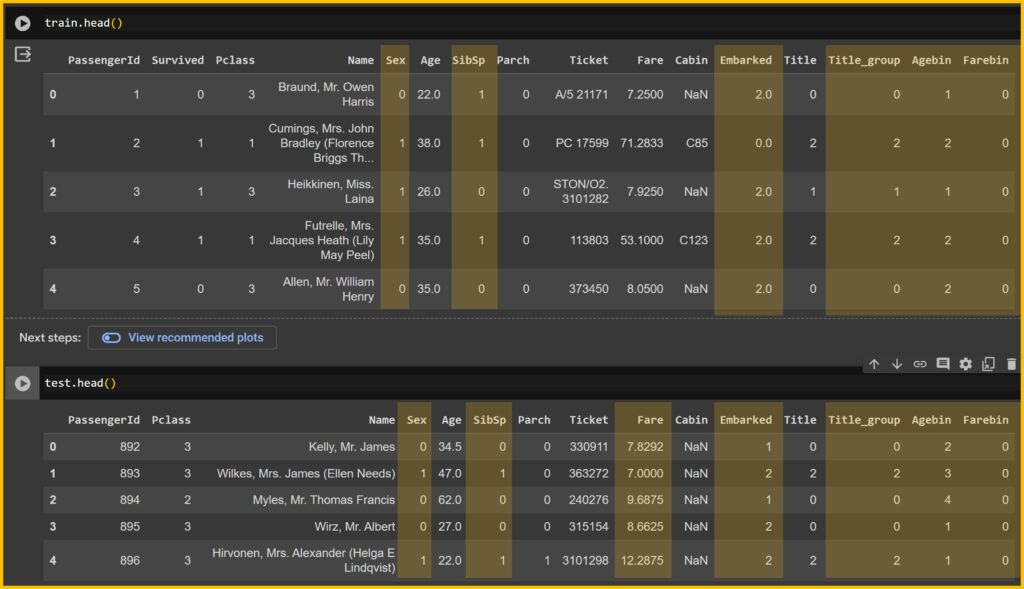
train.head()
test.head()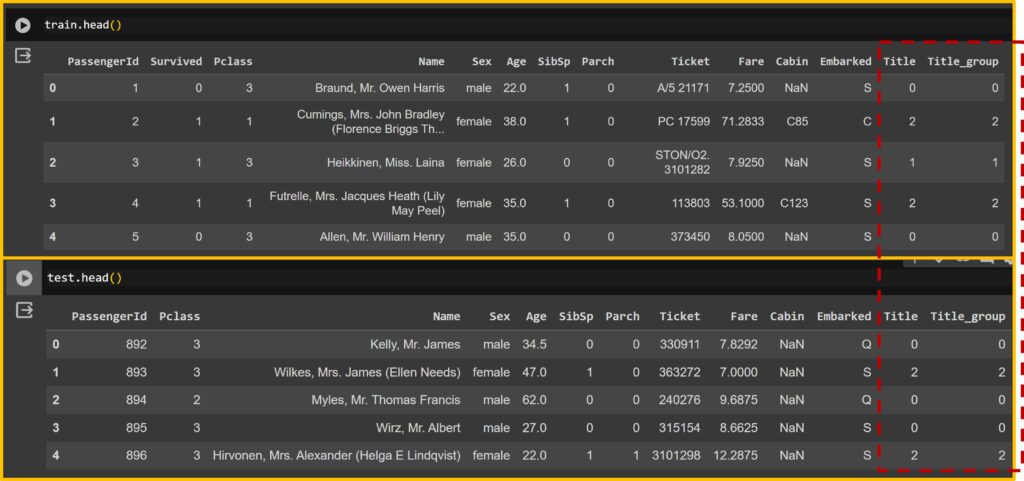
Therefore, the ‘Title’ column and the ‘Title_group’ column will be different, and I’ll be using the ‘Title_group’ column.
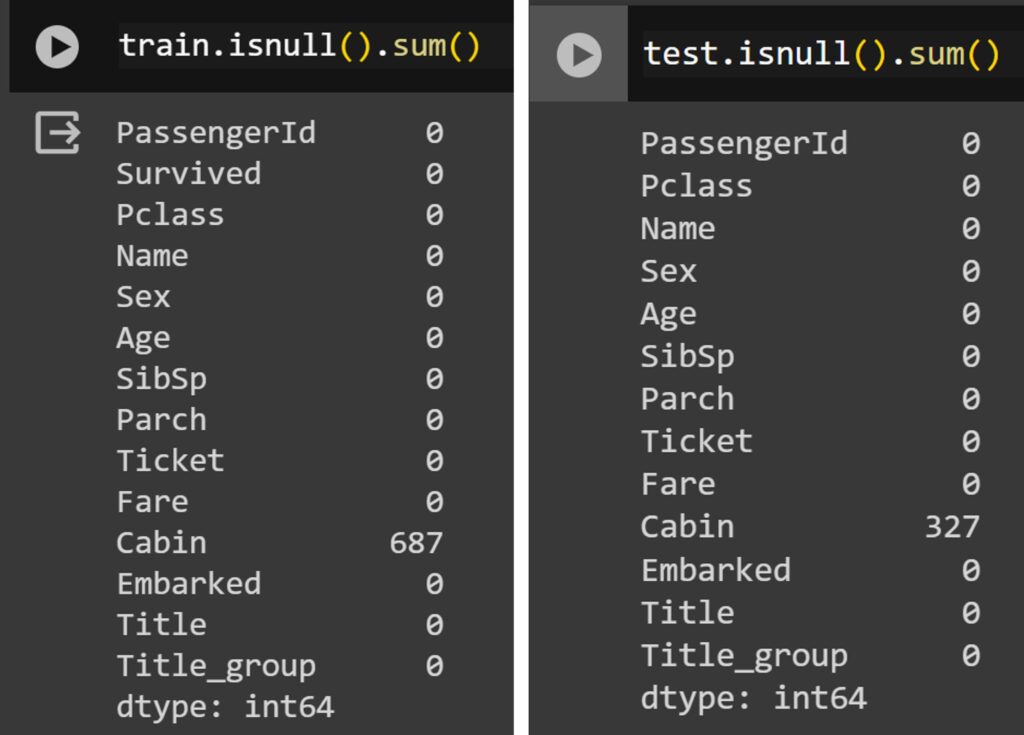
Now, let’s fill in the blanks. I’ll use the median value of the ‘Title_group’ for ‘Age’,
# Age
for dataset in train_test: dataset['Age'].fillna(dataset.groupby("Title_group")["Age"].transform("median"), inplace=True)
and you can see that all null values in ‘Age’ have been filled out.
Let’s fill the blank in ‘Fare’. I assume that the Fare would be different from Pclass, so I’ll use the median value of Pclass.
# Fare
for dataset in train_test: dataset["Fare"].fillna(dataset.groupby("Pclass")["Fare"].transform("median"), inplace=True)
4) to replace categorical values to binary
I already explained how to convert categorical values to binary when explaining ‘Title’. Let’s convert other categorical values.
I’ve identified ‘Sex’ and ‘Embarked’ as categorical values. Since I won’t include ‘Cabin’ in my model, I won’t convert it. However, I’ll convert ‘Embarked’, which has three levels: Q, S, and C. I’ll convert them to 0, 1, and 2, respectively.
# Sex
sex_mapping = {"male": 0, "female":1}
for dataset in train_test:
    dataset["Sex"]=dataset["Sex"].map(sex_mapping)

# Embarked
dataset["Embarked"].unique()
 # array(['Q', 'S', 'C'], dtype=object)

Embarked_mapping = {"C":0, "Q":1, "S":2}
for dataset in train_test:
    dataset["Embarked"]=dataset["Embarked"].map(Embarked_mapping)
“Do you remember there were null values in ‘Embarked’? I’ll use the median value of the title group to fill those blanks.
for dataset in train_test: dataset['Embarked'].fillna(dataset.groupby("Title_group")["Embarked"].transform("median"), inplace=True)Now, there are no null values except for Cabin.
5) Specific grouping
I assume that ‘Age’ would be better divided into groups. This is because the data is biased at some points. For example, even though the same 1-year difference in age, the difference between 1 and 2 years and between 20 and 21 years would be different, and just the age difference would distort the result. Therefore, in this case, it would be better to use groups such as teenager, adult, mid-age, and senior, something like that.
for dataset in train_test:
    dataset["Agebin"]= pd.cut(dataset["Age"], 5, labels= [0,1,2,3,4])
Also, for “Fare”, the variation is so wide, and therefore, it would be better to divide into different “Fare” group.
for dataset in train_test:
    dataset["Farebin"]= pd.cut(dataset["Fare"], 4, labels= [0,1,2,3])
Okay!! Finally I cleaned all data. I’ll only include “Sex”, ” SibSp”, “Embarked”, “Title_group”, “Agebin”, and “Farebin” in my model.
6) to create the answer sheet and final train data
First, let’s delete columns that are not included in the models.
drop_column=["Name", "Age", "SibSp","Parch","Ticket","Fare","Cabin", "Title"]

for dataset in train_test:
    dataset=dataset.drop(drop_column, axis=1, inplace=True)
Second, I’ll extract ‘Survived’ as a separate variable. Actually, it’s an answer sheet!!
target= train["Survived"]
target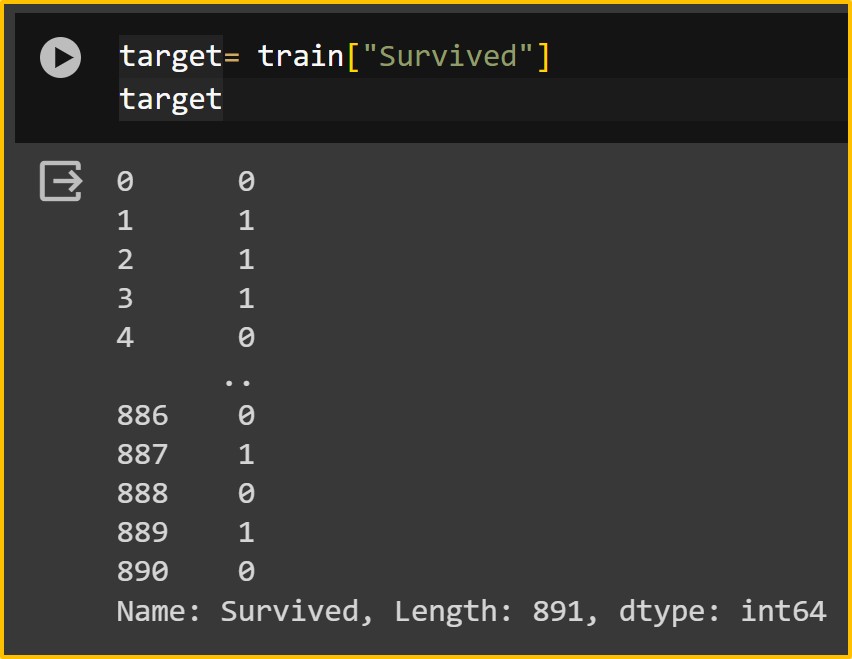
Third, since “PassengerId” merely represents the sequence of passengers, it is not used for training. Similarly, “Survived” represents the outcome and should not be included in training. It is separated and stored in the target variable, then removed from the training data.
drop_column2=["PassengerId", "Survived"]
train_data=train.drop(drop_column2, axis=1)
train_data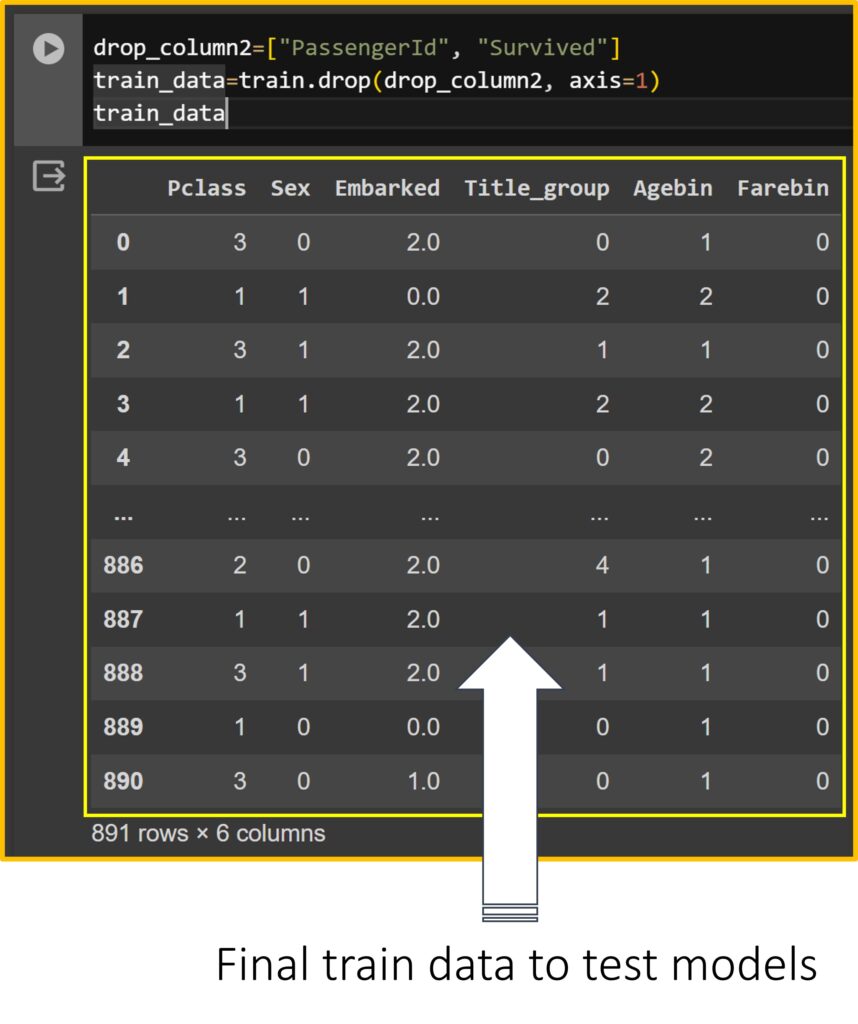
7) Testing the Models
It has been a long journey. From now on, let’s test the models. I’ll use five different models.
from sklearn.tree import DecisionTreeClassifier
from sklearn.ensemble import RandomForestClassifier
from sklearn.naive_bayes import GaussianNB
from sklearn.svm import SVC
from sklearn.linear_model import LogisticRegression
and run each model to find the best accuracy.
# Initialize Logistic Regression model
clf1 = LogisticRegression()

# Fit the model on the training data
clf1.fit(train_data, target)

# Check accuracy on the training data
accuracy = clf1.score(train_data, target)
print("Accuracy:", accuracy)
# Accuracy: 0.792368125701459
## Initialize Random forest model
clf2 = RandomForestClassifier()
# Fit the model on the training data
clf2.fit(train_data, target)
# Check accuracy on the training data
accuracy = clf2.score(train_data, target)
print("Accuracy:", accuracy)
# Accuracy: 0.8417508417508418# Initialize Gaussian model
clf3 = GaussianNB()
# Fit the model on the training data
clf3.fit(train_data, target)
# Check accuracy on the training data
accuracy = clf3.score(train_data, target)
print("Accuracy:", accuracy)
# Accuracy: 0.792368125701459# Initialize Decision Tree model
clf4 = DecisionTreeClassifier()
# Fit the model on the training data
clf4.fit(train_data, target)
# Check accuracy on the training data
accuracy = clf4.score(train_data, target)
print("Accuracy:", accuracy)
# Accuracy: 0.8417508417508418# Initialize SVC model
clf5 = SVC()
# Fit the model on the training data
clf5.fit(train_data, target)
# Check accuracy on the training data
accuracy = clf5.score(train_data, target)
print("Accuracy:", accuracy)
#Accuracy: 0.8271604938271605I’ll choose Random forest model.
8) to create the final test data
For test data, it should be the same format as the train data. So, I’ll delete “PassengerId”
drop_column3=["PassengerId"]
test_data=test.drop(drop_column3, axis=1)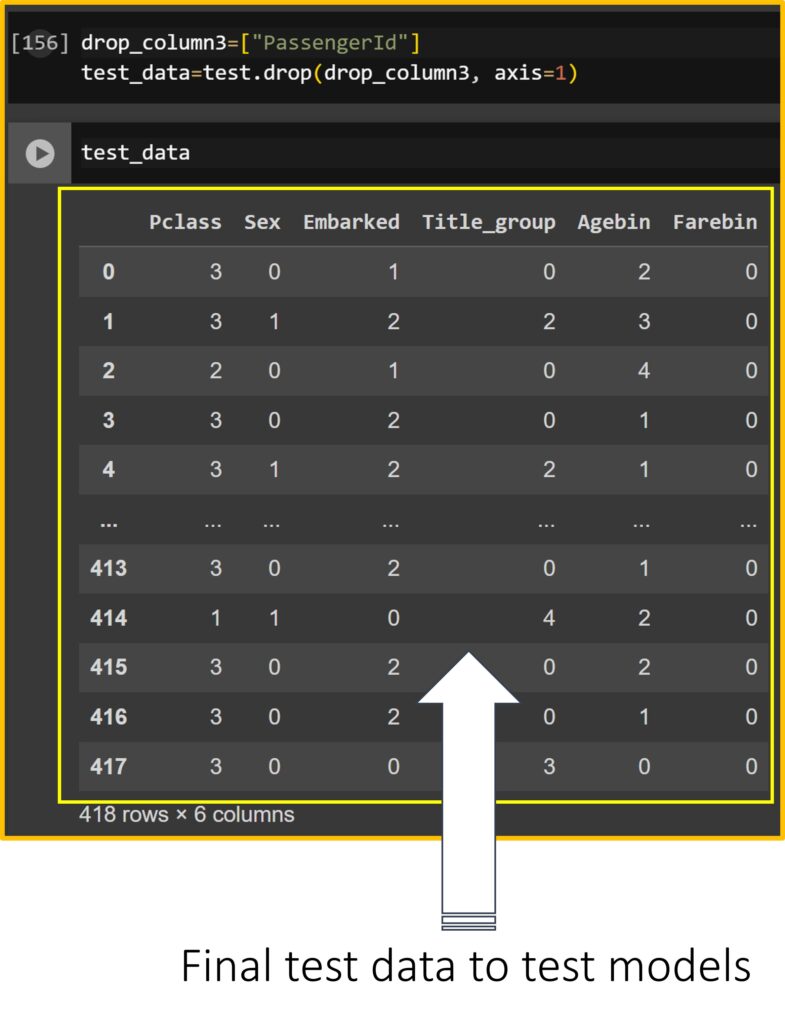
The basic flow of machine learning!!
9) Prediction
Now, I’ll predict the survivors using the model I chose.
predict= clf2.predict(test_data)
#clf2= Random forest model
and I’ll add “PassengerId” and predicted values.
submission = pd.DataFrame({
    'PassengerId' : test['PassengerId'],
    'Survived' : predict})
Then, I’ll save this data to .csv file.
submission.to_csv('submission.csv', index=False)

submission = pd.read_csv("submission.csv")
submission.head()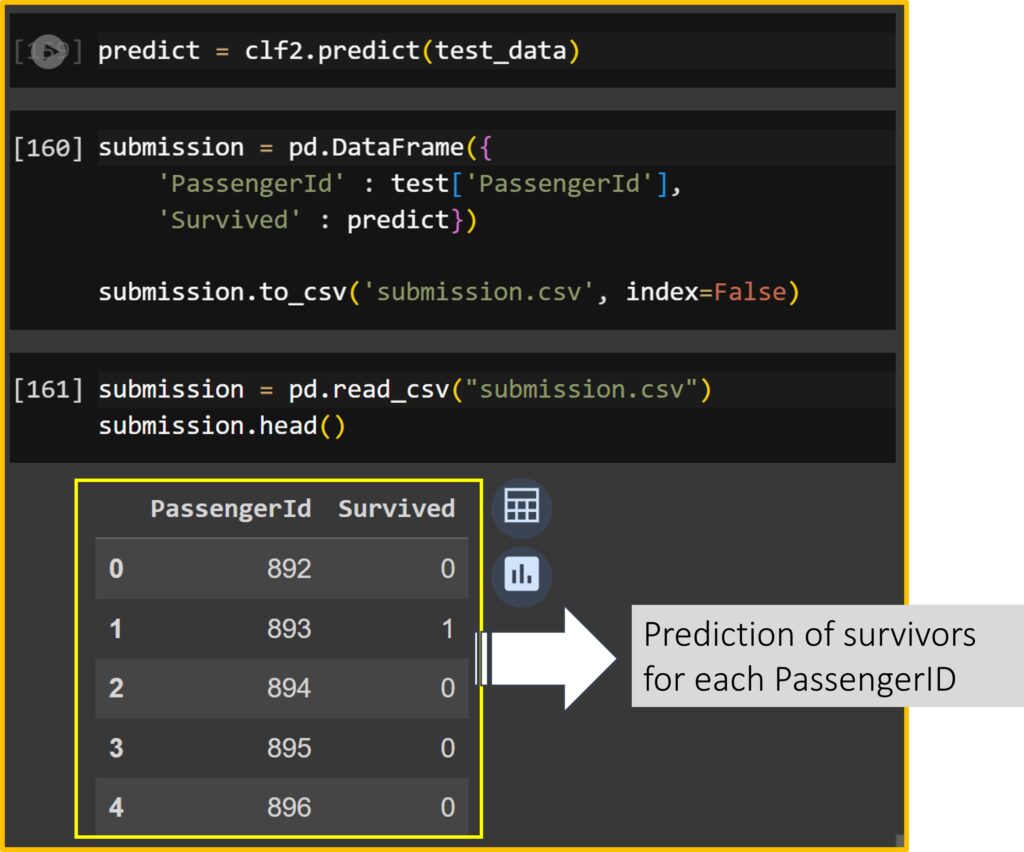
Now, I created the prediction about survivors for each PassengerID.
For example, PassengerID 892 is a middle-aged man (Sex: 0 = male, Agebin: 2 = 3rd age group) who stayed in Pclass 3, embarked at Queenstown (Embarked: 1 = Q), and purchased a cheap ticket (Farebin: 0 = 1st fare group).
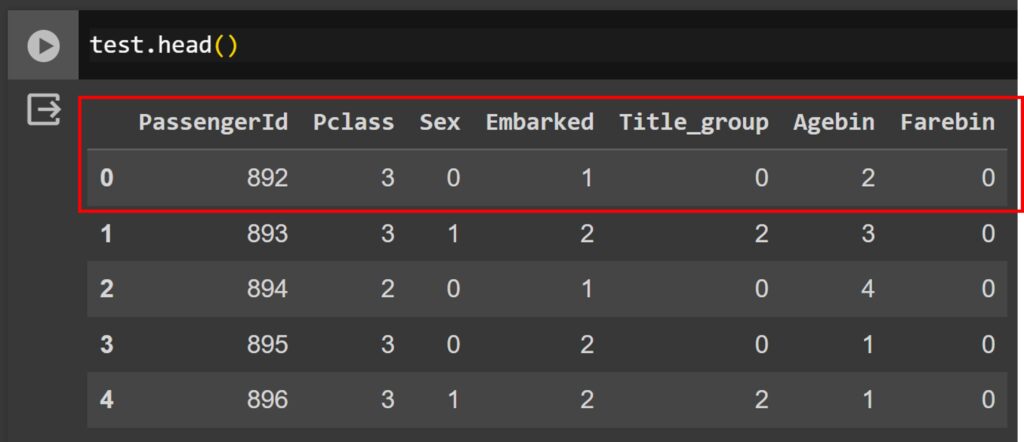
According to the model we accepted, will he survive or be dead? The model tells us he is dead (0 = dead, 1 = Survival). See the data dictionary: https://www.kaggle.com/competitions/titanic/data
Now, let’s verify how much our model is accurate. First, let’s download the data in my Google Drive.
import shutil
shutil.copy("submission.csv", "/content/drive/My Drive/submission.csv")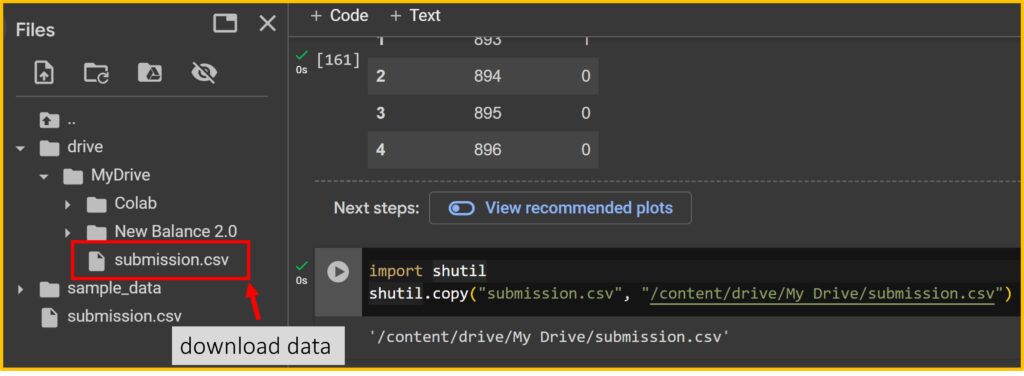
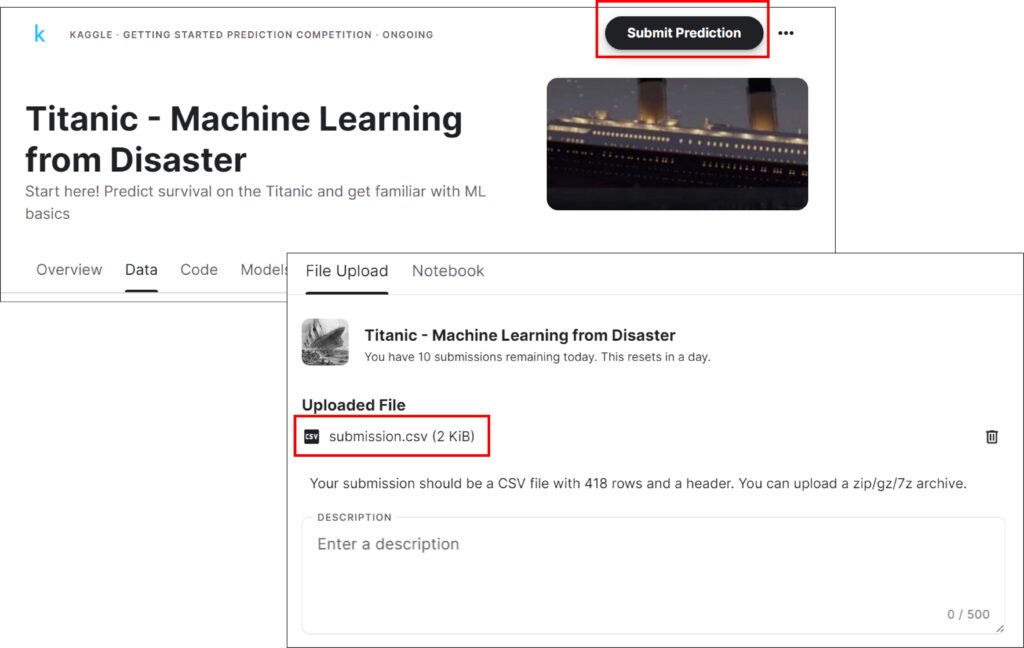
After downloading data, upload the data to Kaggle: https://www.kaggle.com/competitions/titanic/
Click the “Submit Prediction” and upload the data.
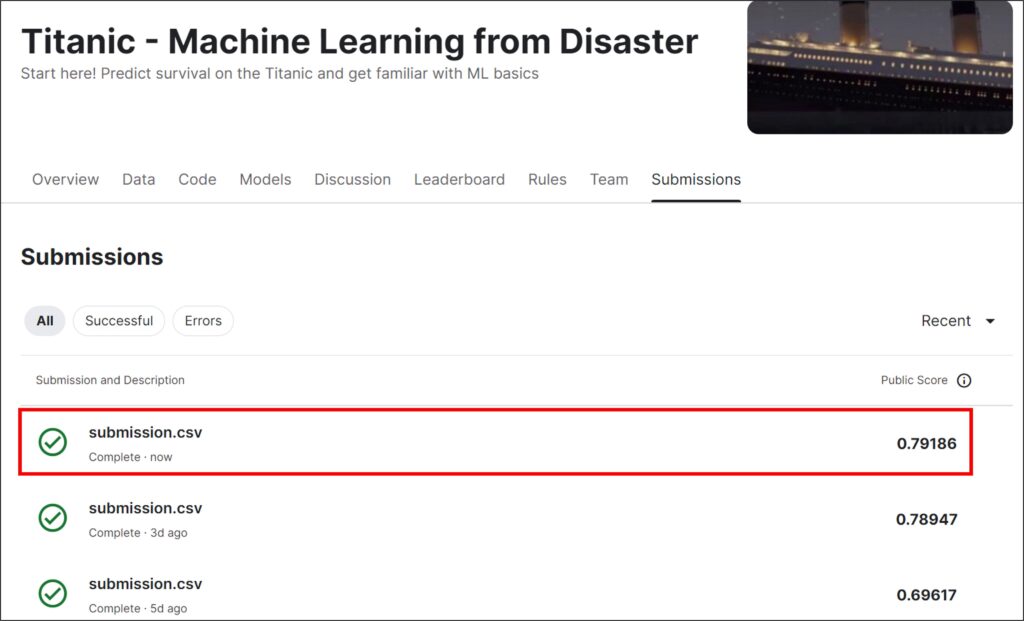
My model has achieved 80% accuracy. I have tried different models, and my score is improving compared to before.
In summary, humans assume that certain variables might affect survival and allow the machine to learn the model based on these variables. We then find the best model and apply it to the actual data. This is one of the processes in machine learning.
full code: https://github.com/agronomy4future/python_code/blob/main/Exploring_Machine_Learning_Fundamentals_Predicting_Survival_on_the_Titanic.ipynb
Reference: Codable* offline course
* Codable: Korean student coding association at University of Illinois Urbana-Champaign.