Efficient Data Management: Variable Filtering in SAS Studio
Today, I’ll introduce how to filter variables after uploading data to SAS Studio. First, let’s upload data to SAS Studio.
library(readr)
github="https://raw.githubusercontent.com/agronomy4future/raw_data_practice/main/sorghum_grain.csv"
dataA= data.frame(read_csv(url(github), show_col_types=FALSE))

dataA
     Location    Crop Plot Block Treatment Treatment_modified Total_DW Grain_yield  AGW    GN
1  Location_A Sorghum   15     I   Control            Control    852.3      4303.6 28.1 31627
2  Location_A Sorghum   17    II   Control            Control   1295.7      6058.4 26.3 40157
3  Location_A Sorghum   19   III   Control            Control   1488.4      7438.7 20.8 45417
4  Location_A Sorghum   22    IV   Control            Control    925.6      5001.3 20.8 20770
5  Location_A Sorghum    1     I       TR1              TR1_2    807.4      3285.2 30.7 14488
6  Location_A Sorghum    4    II       TR1              TR1_2    907.4      3896.1 28.5 20323
7  Location_A Sorghum    9   III       TR1              TR1_2    778.6      3207.3 28.8 15636
8  Location_A Sorghum   10    IV       TR1              TR1_2    895.2      4418.2 28.6 20807
9  Location_A Sorghum    1     I       TR2              TR1_2    748.9      3130.9 49.1 11556
10 Location_A Sorghum    4    II       TR2              TR1_2   1032.4      4809.1 24.8 16821
11 Location_A Sorghum    9   III       TR2              TR1_2   1388.2      6409.9 26.7 32546
12 Location_A Sorghum   10    IV       TR2              TR1_2   1215.1      5183.3 29.3 20720
13 Location_A Sorghum    1     I       TR3                TR3    668.7      3008.1 25.5 10390
14 Location_A Sorghum    4    II       TR3                TR3   1564.1      7160.5 23.9 42890
15 Location_A Sorghum    9   III       TR3                TR3   1283.4      6284.1 23.9 23713
16 Location_A Sorghum   10    IV       TR3                TR3   1612.0      7445.1 20.9 34173
17 Location_A Sorghum    1     I       TR4              TR4_5   1010.5      4340.3 29.2 23492
18 Location_A Sorghum    4    II       TR4              TR4_5    757.4      2865.3 29.2 17564
19 Location_A Sorghum    9   III       TR4              TR4_5   1087.1      5106.0 25.4 30184
20 Location_A Sorghum   10    IV       TR4              TR4_5   1167.7      5383.6 27.7 23543
21 Location_A Sorghum    1     I       TR5              TR4_5    783.3      2765.0 26.5 22890
22 Location_A Sorghum    4    II       TR5              TR4_5   1002.5      3965.2 28.8 20570
23 Location_A Sorghum    9   III       TR5              TR4_5    733.4      3445.1 29.5 15980
24 Location_A Sorghum   10    IV       TR5              TR4_5   1067.9      5000.5 27.7 28911
I’ll summarize data based on Treatment_modified.
library(dplyr)
summary=data.frame(dataA %>%
                   group_by(Location,Block, Treatment_modified) %>%
                   dplyr::summarize(across(c(Grain_yield,GN,AGW),
                           .fns= list(Mean=~mean(., na.rm=TRUE)))))

summary
     Location Block Treatment_modified Grain_yield_Mean GN_Mean AGW_Mean
1  Location_A     I            Control          4303.60 31627.0    28.10
2  Location_A     I              TR1_2          3208.05 13022.0    39.90
3  Location_A     I                TR3          3008.10 10390.0    25.50
4  Location_A     I              TR4_5          3552.65 23191.0    27.85
5  Location_A    II            Control          6058.40 40157.0    26.30
6  Location_A    II              TR1_2          4352.60 18572.0    26.65
7  Location_A    II                TR3          7160.50 42890.0    23.90
8  Location_A    II              TR4_5          3415.25 19067.0    29.00
9  Location_A   III            Control          7438.70 45417.0    20.80
10 Location_A   III              TR1_2          4808.60 24091.0    27.75
11 Location_A   III                TR3          6284.10 23713.0    23.90
12 Location_A   III              TR4_5          4275.55 23082.0    27.45
13 Location_A    IV            Control          5001.30 20770.0    20.80
14 Location_A    IV              TR1_2          4800.75 20763.5    28.95
15 Location_A    IV                TR3          7445.10 34173.0    20.90
16 Location_A    IV              TR4_5          5192.05 26227.0    27.70
I want to summarize for each unique ID. So, I’ll add numbers from 1 up to the end.
dataA= dataA %>%
       mutate(No=1:nrow(dataA))

dataA
 Location    Crop Plot Block Treatment Treatment_modified Total_DW Grain_yield  AGW    GN No
1  Location_A Sorghum   15     I   Control            Control    852.3      4303.6 28.1 31627  1
2  Location_A Sorghum   17    II   Control            Control   1295.7      6058.4 26.3 40157  2
3  Location_A Sorghum   19   III   Control            Control   1488.4      7438.7 20.8 45417  3
4  Location_A Sorghum   22    IV   Control            Control    925.6      5001.3 20.8 20770  4
5  Location_A Sorghum    1     I       TR1              TR1_2    807.4      3285.2 30.7 14488  5
6  Location_A Sorghum    4    II       TR1              TR1_2    907.4      3896.1 28.5 20323  6
7  Location_A Sorghum    9   III       TR1              TR1_2    778.6      3207.3 28.8 15636  7
8  Location_A Sorghum   10    IV       TR1              TR1_2    895.2      4418.2 28.6 20807  8
9  Location_A Sorghum    1     I       TR2              TR1_2    748.9      3130.9 49.1 11556  9
10 Location_A Sorghum    4    II       TR2              TR1_2   1032.4      4809.1 24.8 16821 10
11 Location_A Sorghum    9   III       TR2              TR1_2   1388.2      6409.9 26.7 32546 11
12 Location_A Sorghum   10    IV       TR2              TR1_2   1215.1      5183.3 29.3 20720 12
13 Location_A Sorghum    1     I       TR3                TR3    668.7      3008.1 25.5 10390 13
14 Location_A Sorghum    4    II       TR3                TR3   1564.1      7160.5 23.9 42890 14
15 Location_A Sorghum    9   III       TR3                TR3   1283.4      6284.1 23.9 23713 15
16 Location_A Sorghum   10    IV       TR3                TR3   1612.0      7445.1 20.9 34173 16
17 Location_A Sorghum    1     I       TR4              TR4_5   1010.5      4340.3 29.2 23492 17
18 Location_A Sorghum    4    II       TR4              TR4_5    757.4      2865.3 29.2 17564 18
19 Location_A Sorghum    9   III       TR4              TR4_5   1087.1      5106.0 25.4 30184 19
20 Location_A Sorghum   10    IV       TR4              TR4_5   1167.7      5383.6 27.7 23543 20
21 Location_A Sorghum    1     I       TR5              TR4_5    783.3      2765.0 26.5 22890 21
22 Location_A Sorghum    4    II       TR5              TR4_5   1002.5      3965.2 28.8 20570 22
23 Location_A Sorghum    9   III       TR5              TR4_5    733.4      3445.1 29.5 15980 23
24 Location_A Sorghum   10    IV       TR5              TR4_5   1067.9      5000.5 27.7 28911 24
and I’ll summarize data again.
summary=data.frame(dataA %>%
                  group_by(No, Location,Block, Treatment_modified) %>%
                  dplyr::summarize(across(c(Grain_yield,GN,AGW),
                               .fns= list(Mean=~mean(., na.rm=TRUE)))))

summary
   No   Location Block Treatment_modified Grain_yield_Mean GN_Mean AGW_Mean
1   1 Location_A     I            Control           4303.6   31627     28.1
2   2 Location_A    II            Control           6058.4   40157     26.3
3   3 Location_A   III            Control           7438.7   45417     20.8
4   4 Location_A    IV            Control           5001.3   20770     20.8
5   5 Location_A     I              TR1_2           3285.2   14488     30.7
6   6 Location_A    II              TR1_2           3896.1   20323     28.5
7   7 Location_A   III              TR1_2           3207.3   15636     28.8
8   8 Location_A    IV              TR1_2           4418.2   20807     28.6
9   9 Location_A     I              TR1_2           3130.9   11556     49.1
10 10 Location_A    II              TR1_2           4809.1   16821     24.8
11 11 Location_A   III              TR1_2           6409.9   32546     26.7
12 12 Location_A    IV              TR1_2           5183.3   20720     29.3
13 13 Location_A     I                TR3           3008.1   10390     25.5
14 14 Location_A    II                TR3           7160.5   42890     23.9
15 15 Location_A   III                TR3           6284.1   23713     23.9
16 16 Location_A    IV                TR3           7445.1   34173     20.9
17 17 Location_A     I              TR4_5           4340.3   23492     29.2
18 18 Location_A    II              TR4_5           2865.3   17564     29.2
19 19 Location_A   III              TR4_5           5106.0   30184     25.4
20 20 Location_A    IV              TR4_5           5383.6   23543     27.7
21 21 Location_A     I              TR4_5           2765.0   22890     26.5
22 22 Location_A    II              TR4_5           3965.2   20570     28.8
23 23 Location_A   III              TR4_5           3445.1   15980     29.5
24 24 Location_A    IV              TR4_5           5000.5   28911     27.7
Then, I’ll download this data to my PC.
library(writexl)
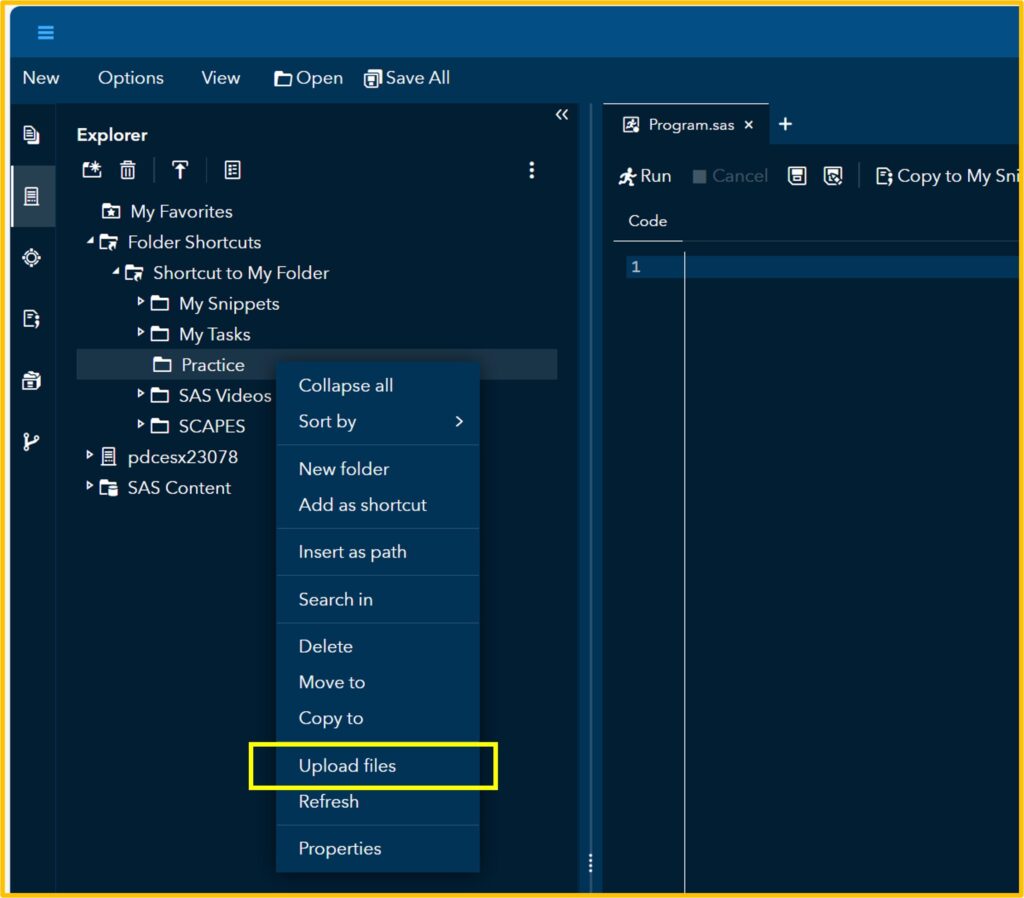
write_xlsx (summary,"C:/Users/Desktop/sorghum.xlsx")1) to upload data to SAS
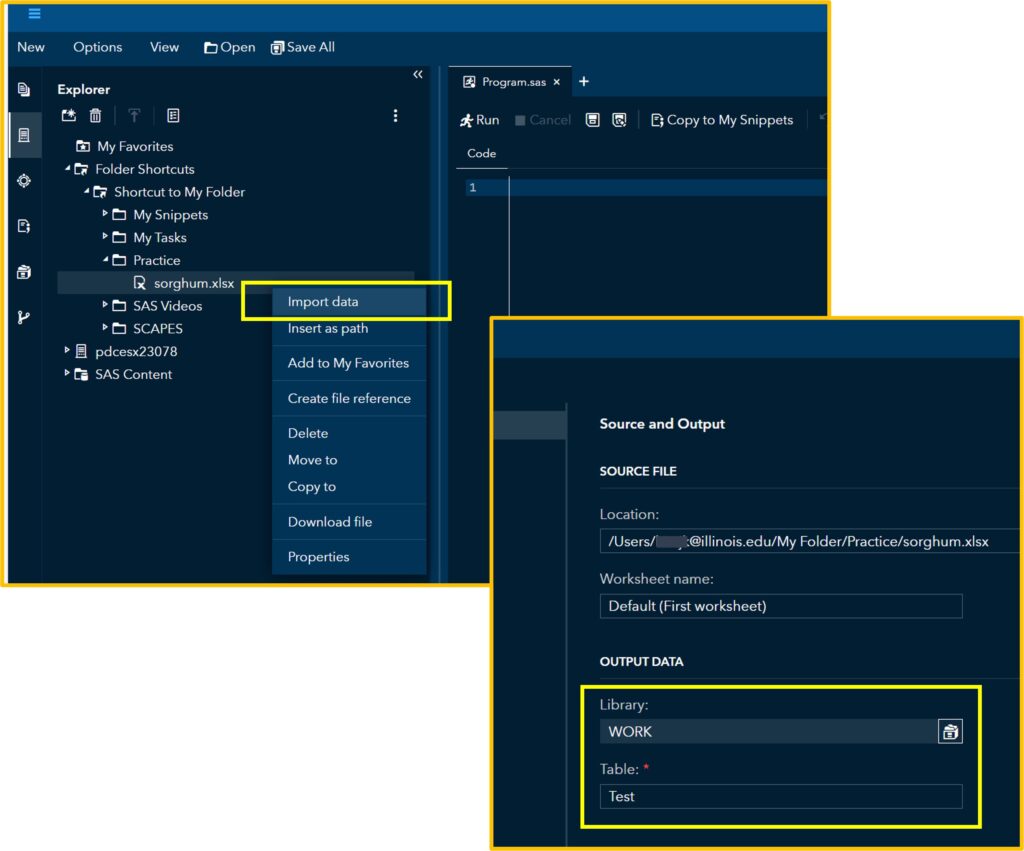
First, let’s upload the data to SAS. I’ll assign this data to the Test table that I created.
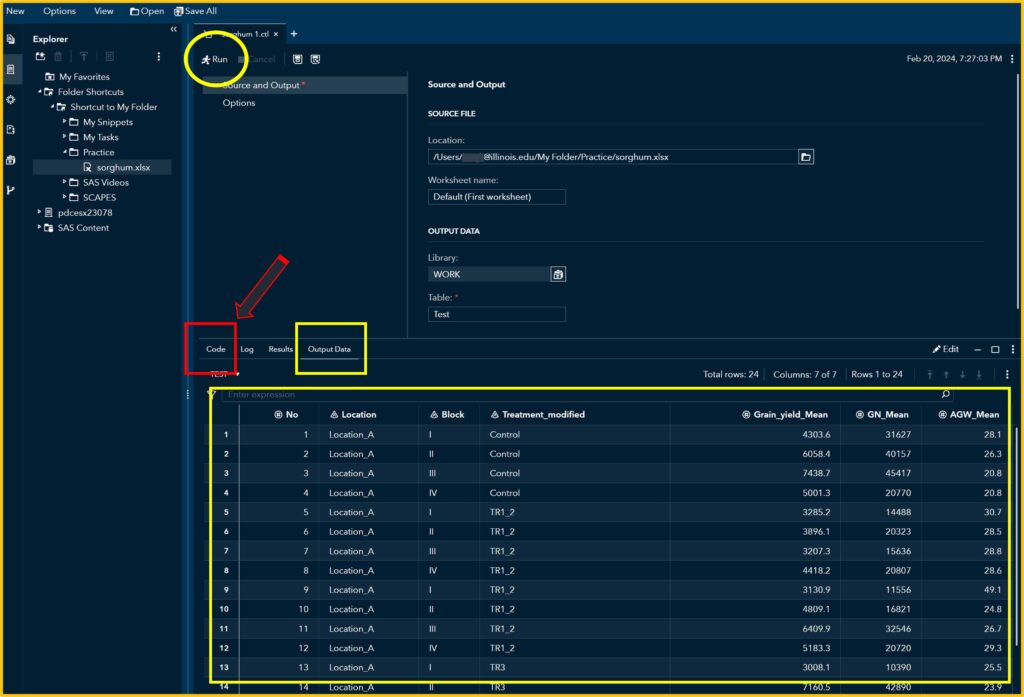
If you click Run, you can see the uploaded data in the Output Data. Then, click the Code tab.
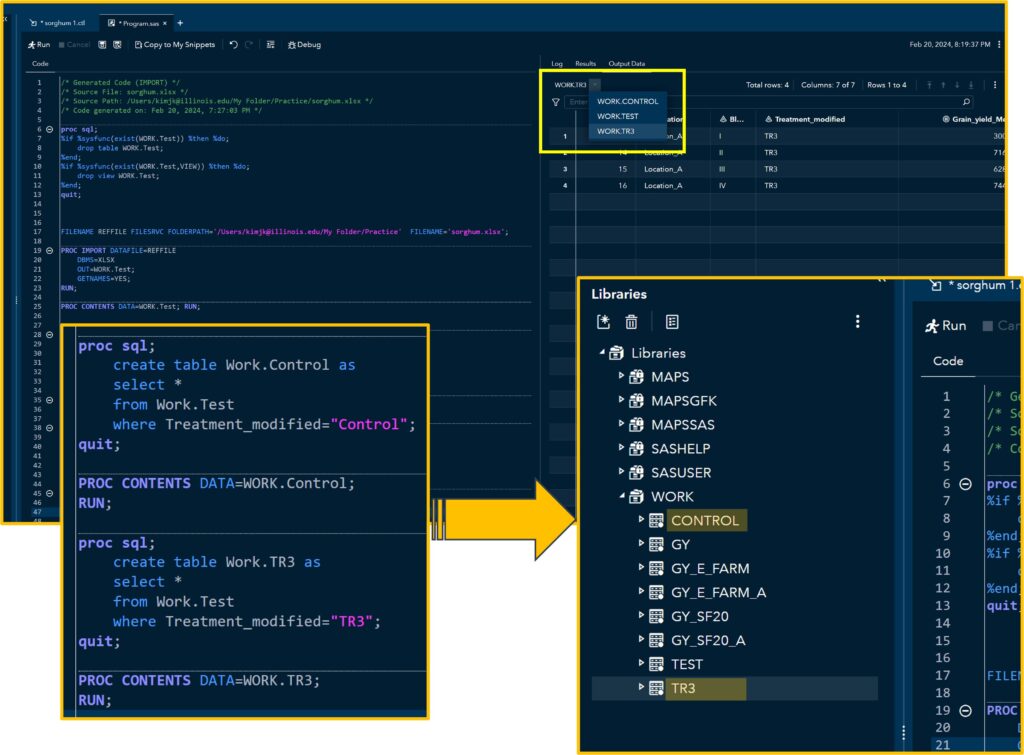
2) Coding
You can see the code that allows you to display the data. Click Edit.
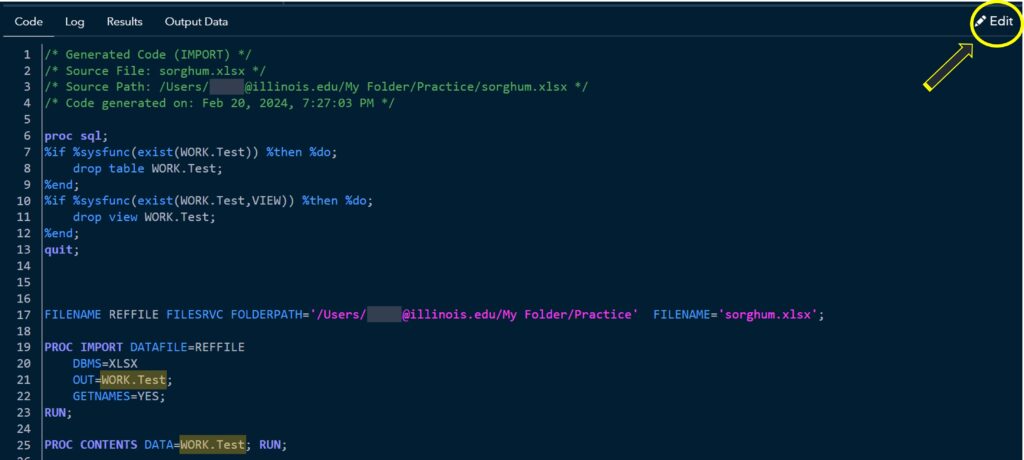
Then, you can add more codes. I’ll add the following codes:
proc sql;
    create table Work.Control as
    select *
    from Work.Test
    where Treatment_modified="Control";
quit;

PROC CONTENTS DATA=WORK.Control;
RUN;

proc sql;
    create table Work.TR3 as
    select *
    from Work.Test
    where Treatment_modified="TR3";
quit;

PROC CONTENTS DATA=WORK.TR3;
RUN;
and run the code. You can find the newly created tables in the Libraries. In this code, I created two tables named Control and TR3, filtering specific variables.
/* Generated Code (IMPORT) */
/* Source File: sorghum.xlsx */
/* Source Path: /Users/***@illinois.edu/My Folder/Practice/sorghum.xlsx */
/* Code generated on: Feb 20, 2024, 7:27:03 PM */

proc sql;
%if %sysfunc(exist(WORK.Test)) %then %do;
    drop table WORK.Test;
%end;
%if %sysfunc(exist(WORK.Test,VIEW)) %then %do;
    drop view WORK.Test;
%end;
quit;


FILENAME REFFILE FILESRVC FOLDERPATH='/Users/***@illinois.edu/My Folder/Practice'  FILENAME='sorghum.xlsx';

PROC IMPORT DATAFILE=REFFILE
	DBMS=XLSX
	OUT=WORK.Test;
	GETNAMES=YES;
RUN;

PROC CONTENTS DATA=WORK.Test; RUN;


proc sql;
    create table Work.Control as
    select *
    from Work.Test
    where Treatment_modified="Control";
quit;

PROC CONTENTS DATA=WORK.Control;
RUN;

proc sql;
    create table Work.TR3 as
    select *
    from Work.Test
    where Treatment_modified="TR3";
quit;

PROC CONTENTS DATA=WORK.TR3;
RUN;