In R, how do I divide the legend into two rows in a graph?
#install.packages("readr")
library(readr)

github="https://raw.githubusercontent.com/agronomy4future/raw_data_practice/main/fertilizer_treatment.csv"
dataA= data.frame(read_csv(url(github),show_col_types = FALSE))
library(dplyr)
dataB= data.frame(dataA %>%
group_by(Genotype, variable) %>%
dplyr::summarize(across(c(value),
.fns= list(Mean = mean,
SD= sd,
n= length,
se= ~ sd(.)/sqrt(length(.))))))
dataB
Genotype variable value_Mean value_SD value_n value_se
1 Genotype_A Control 36.050 7.220572 4 3.610286
2 Genotype_A Fertilizer1 50.625 6.733684 4 3.366842
3 Genotype_A Fertilizer2 45.850 6.943822 4 3.471911
4 Genotype_A Fertilizer3 37.300 7.266820 4 3.633410
5 Genotype_B Control 50.850 14.552548 4 7.276274
6 Genotype_B Fertilizer1 55.375 11.368487 4 5.684244
7 Genotype_B Fertilizer2 53.100 11.581019 4 5.790509
8 Genotype_B Fertilizer3 54.300 8.504509 4 4.252254
9 Genotype_C Control 53.925 7.982637 4 3.991319
10 Genotype_C Fertilizer1 51.375 8.327615 4 4.163807
11 Genotype_C Fertilizer2 55.875 9.059939 4 4.529970
12 Genotype_C Fertilizer3 56.050 5.363146 4 2.681573
13 Genotype_D Control 61.925 10.692482 4 5.346241
14 Genotype_D Fertilizer1 63.425 6.336863 4 3.168432
15 Genotype_D Fertilizer2 57.675 11.139532 4 5.569766
16 Genotype_D Fertilizer3 61.250 11.357670 4 5.678835ggplot(data=dataB, aes(x=Genotype, y=value_Mean, fill=variable))+
geom_bar(stat="identity",position="dodge", width=0.9, size=1) +
geom_errorbar(aes(ymin=value_Mean-value_se, ymax=value_Mean+value_se),
position=position_dodge(0.9), width=0.5) +
scale_fill_manual(values=c("coral4","grey65","darkslategrey","orange"))+
scale_y_continuous(breaks=seq(0,100,20), limits = c(0,100)) +
labs(x="Genotype", y=bquote("Grain yield "~Mg~ha^-1*")")) +
guides(fill = guide_legend(nrow = 2)) +
theme_classic(base_size=18, base_family="serif")+
theme(legend.position=c(0.7,0.93),
legend.title=element_blank(),
legend.key=element_rect(color="white", fill="white"),
legend.text=element_text(family="serif", face="plain",
size=15, color= "Black"),
legend.background=element_rect(fill="white"),
axis.line=element_line(linewidth=0.5, colour="black"),
strip.background=element_rect(color="white",
linewidth=0.5,linetype="solid"))+
windows(width=7.5, height=5)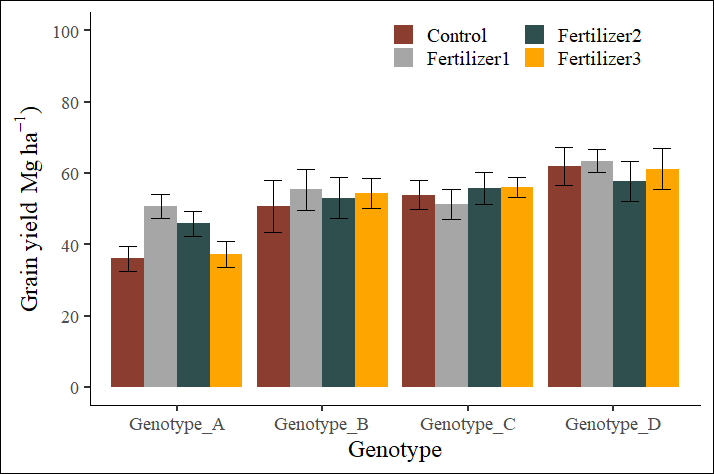
full code: https://github.com/agronomy4future/r_code/blob/main/In_R%2C_how_do_I_divide_the_legend_into_two_rows_in_a_graph%3F.ipynb
© 2022 – 2023 https://agronomy4future.com