Drawing Lines in ggplot()
When using ggplot() to create multiple graphs, there are times when you might want to add separate lines to the graphs. Today, I’ll be posting about how to draw additional lines on graphs.
Let’s start by generating a simple piece of data.
x=c(10,20,30,40,50)
y=c(5,8,12,18,19)
data=data.frame(x,y)

   x  y
1 10  5
2 20  8
3 30 12
4 40 18
5 50 19
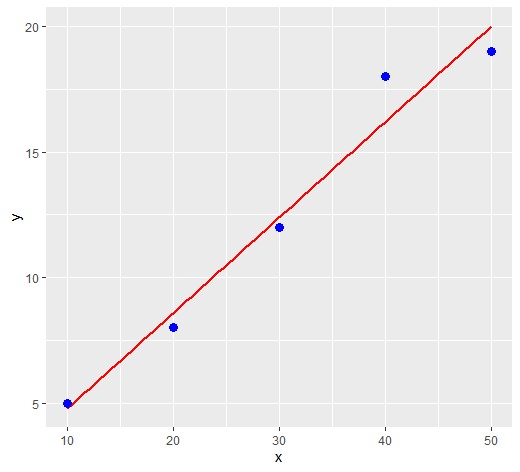
Next, I will proceed to draw a regression graph for this data.
library(ggplot2)
ggplot(data=data, aes(x=x, y=y)) +
  geom_smooth(method= lm, level=0.95, se=FALSE, linetype=1, color="Red", size=1, formula= y ~ x) +
  geom_point(col="Blue", size=3) +
windows(width=5.5, height=5)
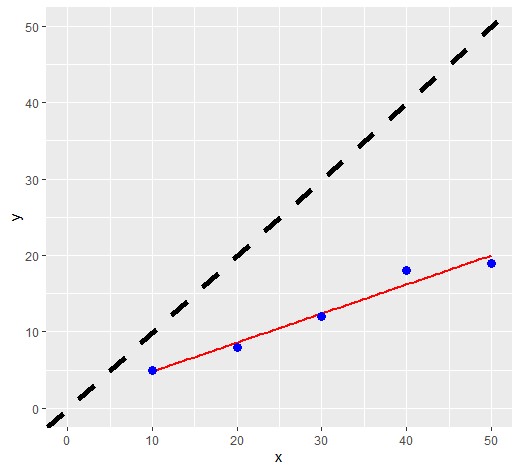
1) Drawing a 1:1 ratio line.
To examine the slope of the regression line, I would like to draw a 1:1 ratio line.
geom_abline (slope=1, linetype = "dashed", color="Red")
You can simply insert geom_abline() into the existing ggplot() code.
http://www.sthda.com/english/wiki/ggplot2-line-types-how-to-change-line-types-of-a-graph-in-r-software
You can find the types of linetypes on the website above.
ggplot(data=data, aes(x=x, y=y)) +
  geom_smooth(method= lm, level=0.95, se=FALSE, linetype=1, color="Red", size=1, formula= y ~ x) +
  geom_point(col="Blue", size=3) +
  geom_abline (slope=1, linetype= "dashed", color="Black", size=2) +
  scale_x_continuous(breaks= seq(0,50,10), limits= c(0,50)) +
  scale_y_continuous(breaks= seq(0,50,10), limits= c(0,50)) +
windows(width=5.5, height=5)
When you run the code, you can obtain a graph as shown below.

2) Drawing vertical and horizontal lines.
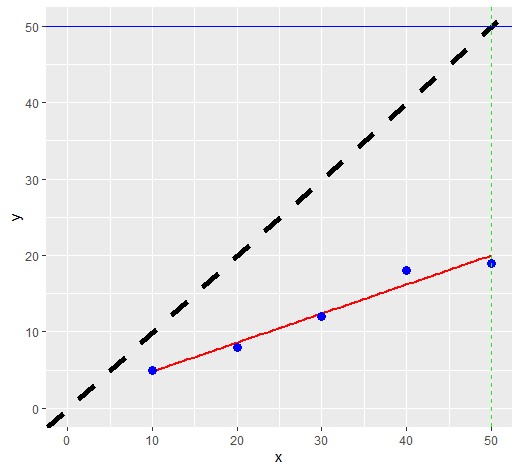
Now, I would like to draw vertical and horizontal lines. Let’s draw a line along y-axis at 50 and a vertical line along x-axis at 40. You can simply insert geom_vline() and geom_hline() into the existing ggplot() code.
   geom_vline(xintercept= 50, linetype= "dashed", color="Green") +
   geom_hline(yintercept=50, linetype="solid", color= "Blue")
If you input the code below, you can see that lines are drawn as shown below.
ggplot(data=data, aes(x=x, y=y)) +
  geom_smooth(method= lm, level=0.95, se=FALSE, linetype=1, color="Red", size=1, formula= y ~ x) +
  geom_point(col="Blue", size=3) +
  geom_abline (slope=1, linetype= "dashed", color="Black", size=2) +
  geom_vline(xintercept= 50, linetype= "dashed", color="Green") +
  geom_hline(yintercept=50, linetype="solid", color= "Blue") +
  scale_x_continuous(breaks= seq(0,50,10), limits= c(0,50)) +
  scale_y_continuous(breaks= seq(0,50,10), limits= c(0,50)) +
windows(width=5.5, height=5)
If you’re new to R, try copying the code below and practice drawing lines.
x= c(10,20,30,40,50)
y= c(5,8,12,18,19)
data= data.frame(x,y)

ggplot(data=data, aes(x=x, y=y)) +
  geom_smooth(method= lm, level=0.95, se=FALSE, linetype=1, color="Red", size=1, formula= y ~ x) +
  geom_point(col="Blue", size=3) +
  geom_abline (slope=1, linetype= "dashed", color="Black", size=2) +
  geom_vline(xintercept= 50, linetype= "dashed", color="Green") +
  geom_hline(yintercept=50, linetype="solid", color= "Blue") +
  scale_x_continuous(breaks= seq(0,50,10), limits= c(0,50)) +
  scale_y_continuous(breaks= seq(0,50,10), limits= c(0,50)) +
windows(width=5.5, height=5)