Coding Light Spectrum Curves for Plant Growth in R
Let’s say we collected relative light intensity data across a wide range of the light spectrum in an LED experiment.
library(readr)
github="https://raw.githubusercontent.com/agronomy4future/raw_data_practice/main/light_spectrum.csv"
df= data.frame(read_csv(url(github), show_col_types=FALSE))

head(df, 5)
  spectrum  relative_intensity
1 380       0.01574
2 381       0.01582
3 382       0.01523
4 383       0.01463
5 384       0.01401
.
.
.
and I’d like to create light spectrum curves regarding relative light intensity. First, I’ll define wavelength colors. The color at different ranges of wavelengths is always the same, so if we run this code, we can obtain the same color range at wavelength (which would be the x-axis of the graph).
wavelength= function(wavelengths) {
   # Apply function to each wavelength
           sapply(wavelengths, function(wavelength) {
   # Initialize RGB values
    red= green= blue= 0
   # Determine red and blue values for specific wavelength ranges
    if (wavelength>= 380 & wavelength<440) {
      red=-(wavelength-440)/(440-380)
      blue=1
    } else if (wavelength>=440 & wavelength<490) {
      green=(wavelength-440)/(490-440)
      blue=1
    } else if (wavelength>=490 & wavelength<510) {
      green=1
      blue=-(wavelength-510)/(510-490)
    } else if (wavelength>=510 & wavelength<580) {
      red=(wavelength-510)/(580-510)
      green=1
    } else if (wavelength>=580 & wavelength<645) {
      red=1
      green=-(wavelength-645)/(645-580)
    } else if (wavelength>=645 & wavelength<781) {
      red=1
    }

  # Determine factor for adjusting RGB values
    if (wavelength>=380 & wavelength<420) {
      fac=0.3+0.7*(wavelength-380)/(420-380)
    } else if (wavelength>=420 & wavelength<701) {
      fac=1
    } else if (wavelength>=701 & wavelength<781) {
      fac=0.3+0.7*(780-wavelength)/(780-700)
    } else {
      fac=0
    }

  # Apply RGB values with factor and return color
    do.call(rgb, as.list((c(red, green, blue) * fac) ^ 0.8))
  })
  }
and let’s create curve graph.
library(ggplot2)
ggplot(df, aes(x=spectrum, y=relative_intensity)) +
  geom_segment(aes(xend=spectrum, yend=0, colour= wavelength(spectrum)),
               linewidth=0.5) +
  geom_line(size=0.05) +
  scale_colour_identity() +
  scale_x_continuous(breaks=seq(400,800,100), limits=c(400,800))+
  scale_y_continuous(breaks=seq(0,1,0.25), limits=c(0,1),
                     labels=scales::percent)+
  geom_vline(xintercept=400, linetype= "dashed", color="grey75") +
  geom_vline(xintercept=500, linetype= "dashed", color="grey75") +
  geom_vline(xintercept=600, linetype= "dashed", color="grey75") +
  geom_vline(xintercept=700, linetype= "dashed", color="grey75") +
  geom_vline(xintercept=800, linetype= "dashed", color="grey75") +
  labs(x="Wavelength (mm)", y="Relative Intensity") +
  theme_classic(base_size=22, base_family="serif")+
  theme(axis.line=element_line(linewidth=0.5, colour="black")) +
windows(width=8, height=4.5)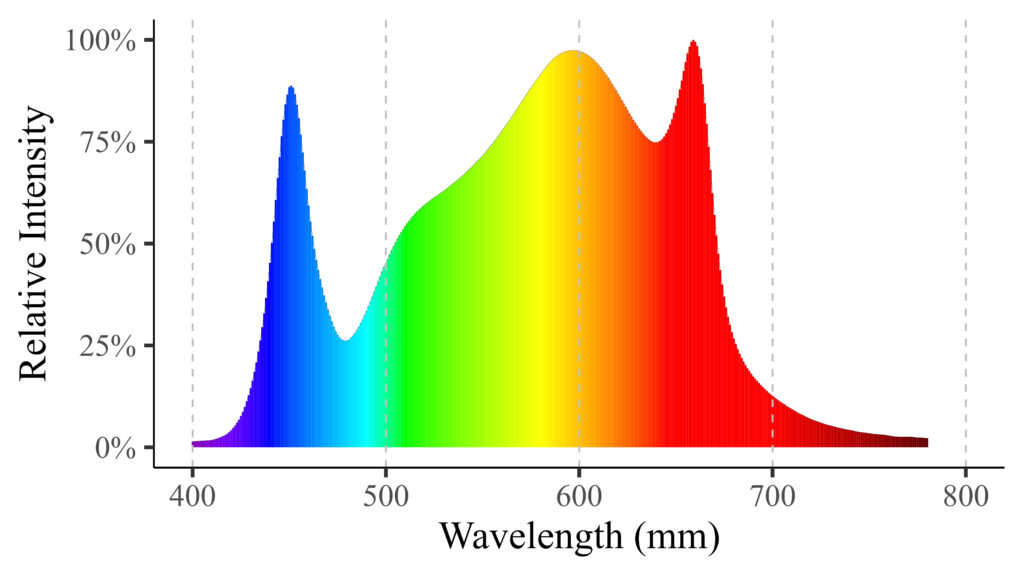
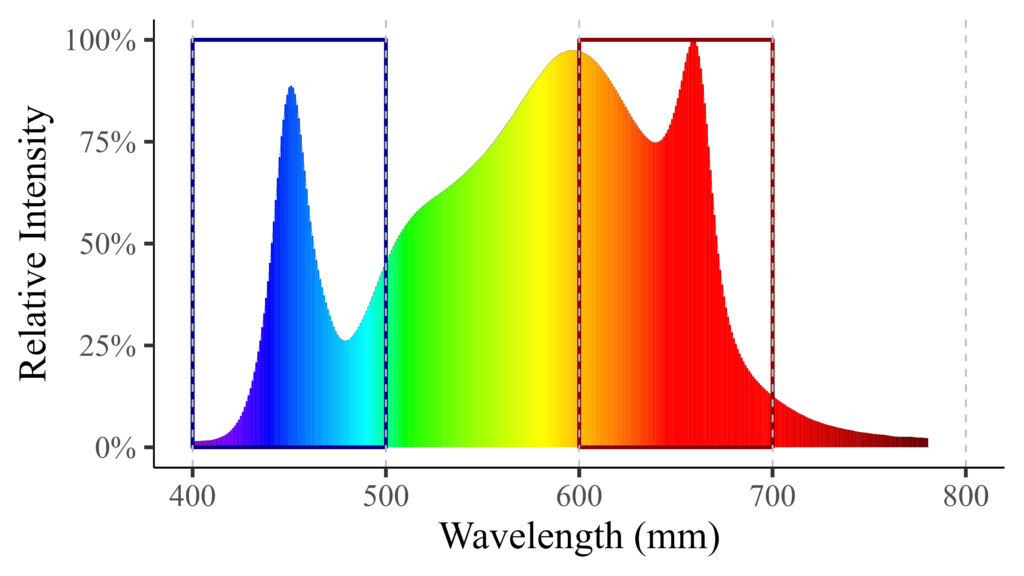
I’ll highlight the ranges of the blue and red spectrums.
library(ggplot2)
ggplot(df, aes(x=spectrum, y=relative_intensity)) +
  geom_segment(aes(xend=spectrum, yend=0, colour= wavelength(spectrum)),
               linewidth=0.5) +
  geom_line(size=0.05) +
  scale_colour_identity() +

  geom_rect(aes(xmin=600, xmax=700, ymin=0, ymax=1),
            fill=NA, color="darkred", linetype="solid", size=1) +
  geom_rect(aes(xmin=400, xmax=500, ymin=0, ymax=1),
            fill=NA, color="darkblue", linetype="solid", size=1) +

  scale_x_continuous(breaks=seq(400,800,100), limits=c(400,800))+
  scale_y_continuous(breaks=seq(0,1,0.25), limits=c(0,1),
                     labels=scales::percent)+
  geom_vline(xintercept=400, linetype= "dashed", color="grey75") +
  geom_vline(xintercept=500, linetype= "dashed", color="grey75") +
  geom_vline(xintercept=600, linetype= "dashed", color="grey75") +
  geom_vline(xintercept=700, linetype= "dashed", color="grey75") +
  geom_vline(xintercept=800, linetype= "dashed", color="grey75") +
  labs(x="Wavelength (mm)", y="Relative Intensity") +
  theme_classic(base_size=22, base_family="serif")+
  theme(axis.line=element_line(linewidth=0.5, colour="black")) +
windows(width=8, height=4.5)
full code: https://github.com/agronomy4future/r_code/blob/main/Coding_Light_Spectrum_Curves_for_Plant_Growth_in_R.ipynb
© 2022 – 2023 https://agronomy4future.com