Utilizing R Studio for Data Grouping and Mean/Standard Error Calculation (feat ddply)
The function I will introduce today is ddply(). This function is convenient for summarizing large amounts of data and can also calculate standard errors, making it easy to create bar graphs. First, install the package.
install.packages ("plyr")
library(plyr)
Once the installation is complete, let’s upload some data.
#install.packages ("readr")
library(readr)

github= "https://raw.githubusercontent.com/agronomy4future/raw_data_practice/main/fertilizer_treatment.csv"
dataA= data.frame(read_csv(url(github), show_col_types = FALSE))
print(dataA)

     Genotype Block    variable value
1  Genotype_A     I     Control  42.9
2  Genotype_A    II     Control  41.6
3  Genotype_A   III     Control  28.9
4  Genotype_A    IV     Control  30.8
5  Genotype_B     I     Control  53.3
6  Genotype_B    II     Control  69.6
7  Genotype_B   III     Control  45.4
8  Genotype_B    IV     Control  35.1
9  Genotype_C     I     Control  62.3
10 Genotype_C    II     Control  58.5
11 Genotype_C   III     Control  44.6
12 Genotype_C    IV     Control  50.3
13 Genotype_D     I     Control  75.4
14 Genotype_D    II     Control  65.6
15 Genotype_D   III     Control  54.0
16 Genotype_D    IV     Control  52.7
17 Genotype_A     I Fertilizer1  53.8
18 Genotype_A    II Fertilizer1  58.5
19 Genotype_A   III Fertilizer1  43.9
20 Genotype_A    IV Fertilizer1  46.3
21 Genotype_B     I Fertilizer1  57.6
22 Genotype_B    II Fertilizer1  69.6
23 Genotype_B   III Fertilizer1  42.4
24 Genotype_B    IV Fertilizer1  51.9
25 Genotype_C     I Fertilizer1  63.4
26 Genotype_C    II Fertilizer1  50.4
27 Genotype_C   III Fertilizer1  45.0
28 Genotype_C    IV Fertilizer1  46.7
29 Genotype_D     I Fertilizer1  70.3
30 Genotype_D    II Fertilizer1  67.3
31 Genotype_D   III Fertilizer1  57.6
32 Genotype_D    IV Fertilizer1  58.5
33 Genotype_A     I Fertilizer2  49.5
34 Genotype_A    II Fertilizer2  53.8
35 Genotype_A   III Fertilizer2  40.7
36 Genotype_A    IV Fertilizer2  39.4
37 Genotype_B     I Fertilizer2  59.8
38 Genotype_B    II Fertilizer2  65.8
39 Genotype_B   III Fertilizer2  41.4
40 Genotype_B    IV Fertilizer2  45.4
41 Genotype_C     I Fertilizer2  64.5
42 Genotype_C    II Fertilizer2  46.1
43 Genotype_C   III Fertilizer2  62.6
44 Genotype_C    IV Fertilizer2  50.3
45 Genotype_D     I Fertilizer2  68.8
46 Genotype_D    II Fertilizer2  65.3
47 Genotype_D   III Fertilizer2  45.6
48 Genotype_D    IV Fertilizer2  51.0
49 Genotype_A     I Fertilizer3  44.4
50 Genotype_A    II Fertilizer3  41.8
51 Genotype_A   III Fertilizer3  28.3
52 Genotype_A    IV Fertilizer3  34.7
53 Genotype_B     I Fertilizer3  64.1
54 Genotype_B    II Fertilizer3  57.4
55 Genotype_B   III Fertilizer3  44.1
56 Genotype_B    IV Fertilizer3  51.6
57 Genotype_C     I Fertilizer3  63.6
58 Genotype_C    II Fertilizer3  56.1
59 Genotype_C   III Fertilizer3  52.7
60 Genotype_C    IV Fertilizer3  51.8
61 Genotype_D     I Fertilizer3  71.6
62 Genotype_D    II Fertilizer3  69.4
63 Genotype_D   III Fertilizer3  56.6
64 Genotype_D    IV Fertilizer3  47.4
This dataset consists of results from cultivating 4 genotypes under 4 different nitrogen treatment conditions with 4 replicates each. In other words, it comprises a total of 64 data points (4 x 4 x 4). When summarizing this data, you can utilize the ddply() function. Now, I’d like to summarize this data by calculating the mean, standard deviation, and standard error. Please write the code in the following format:
dataB= ddply (dataA,c("Genotype","variable"), summarise, mean=mean(value),
sd=sd(value),n=length(value), se=sd/sqrt(n))

     Genotype    variable   mean        sd n       se
1  Genotype_A     Control 36.050  7.220572 4 3.610286
2  Genotype_A Fertilizer1 50.625  6.733684 4 3.366842
3  Genotype_A Fertilizer2 45.850  6.943822 4 3.471911
4  Genotype_A Fertilizer3 37.300  7.266820 4 3.633410
5  Genotype_B     Control 50.850 14.552548 4 7.276274
6  Genotype_B Fertilizer1 55.375 11.368487 4 5.684244
7  Genotype_B Fertilizer2 53.100 11.581019 4 5.790509
8  Genotype_B Fertilizer3 54.300  8.504509 4 4.252254
9  Genotype_C     Control 53.925  7.982637 4 3.991319
10 Genotype_C Fertilizer1 51.375  8.327615 4 4.163807
11 Genotype_C Fertilizer2 55.875  9.059939 4 4.529970
12 Genotype_C Fertilizer3 56.050  5.363146 4 2.681573
13 Genotype_D     Control 61.925 10.692482 4 5.346241
14 Genotype_D Fertilizer1 63.425  6.336863 4 3.168432
15 Genotype_D Fertilizer2 57.675 11.139532 4 5.569766
16 Genotype_D Fertilizer3 61.250 11.357670 4 5.678835
The data was organized into means, standard deviations, and standard errors based on 4 replicates for both the variety and treatment. If the fertilizer treatment does not hold significant meaning, we could also organize the data by grouping only by genotype.
dataC= ddply (dataA,c("Genotype"), summarise, mean=mean(value),
              sd=sd(value),n=length(value), se=sd/sqrt(n))

    Genotype     mean        sd  n       se
1 Genotype_A 42.45625  8.865662 16 2.216415
2 Genotype_B 53.40625 10.606945 16 2.651736
3 Genotype_C 54.30625  7.251250 16 1.812812
4 Genotype_D 61.06875  9.288180 16 2.322045
However, ddply() is considered outdated code!!
Nowadays, no one uses ddply() because there are more convenient methods available. I will introduce the simplest method to summarize data using dplyr().
library(dplyr)
dataB= data.frame(dataA %>%
  group_by(Genotype, variable) %>%
  dplyr::summarize(across(c(value),
                          .fns = list(Mean = mean,
                                      SD = sd,
                                      n = length,
                                      se = ~ sd(.)/sqrt(length(.))))))
dataB
     Genotype    variable value_Mean  value_SD value_n value_se
1  Genotype_A     Control     36.050  7.220572       4 3.610286
2  Genotype_A Fertilizer1     50.625  6.733684       4 3.366842
3  Genotype_A Fertilizer2     45.850  6.943822       4 3.471911
4  Genotype_A Fertilizer3     37.300  7.266820       4 3.633410
5  Genotype_B     Control     50.850 14.552548       4 7.276274
6  Genotype_B Fertilizer1     55.375 11.368487       4 5.684244
7  Genotype_B Fertilizer2     53.100 11.581019       4 5.790509
8  Genotype_B Fertilizer3     54.300  8.504509       4 4.252254
9  Genotype_C     Control     53.925  7.982637       4 3.991319
10 Genotype_C Fertilizer1     51.375  8.327615       4 4.163807
11 Genotype_C Fertilizer2     55.875  9.059939       4 4.529970
12 Genotype_C Fertilizer3     56.050  5.363146       4 2.681573
13 Genotype_D     Control     61.925 10.692482       4 5.346241
14 Genotype_D Fertilizer1     63.425  6.336863       4 3.168432
15 Genotype_D Fertilizer2     57.675 11.139532       4 5.569766
16 Genotype_D Fertilizer3     61.250 11.357670       4 5.678835
Tip) AI can easily summarizes data!!
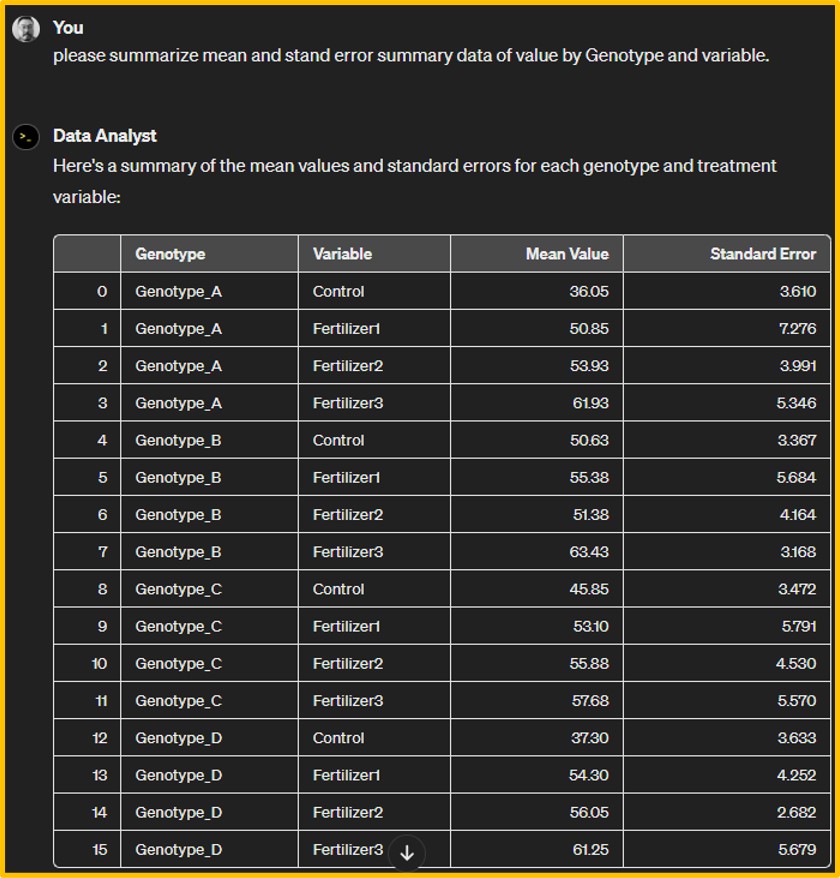
These days we do not have to learn programming code because AI simply summarize the data if we just ask.
ChatGPT - Data Analyst
You can upload the data file to Data Analyst, but I’ll upload code to generate data table. If you run the following code, you can obtain the data frame code to generate data table.
library(readr)
github= "https://raw.githubusercontent.com/agronomy4future/raw_data_practice/main/fertilizer_treatment.csv"
dataA= data.frame(read_csv(url(github), show_col_types = FALSE))
print(dataA)

#remotes::install_github("cynkra/constructive")
library(remote)
constructive::construct(dataA)

data.frame(
  Genotype= rep(rep(c("Genotype_A", "Genotype_B", "Genotype_C", "Genotype_D"), 4), each = 4L),
  Block= rep(c("I", "II", "III", "IV"), 16),
  variable= rep(c("Control", "Fertilizer1", "Fertilizer2", "Fertilizer3"), each= 16L),
  value= c(42.9, 41.6, 28.9, 30.8, 53.3, 69.6, 45.4, 35.1, 62.3, 58.5, 44.6, 50.3, 75.4, 65.6, 54, 52.7, 53.8, 58.5, 43.9, 46.3, 57.6, 69.6, 42.4, 51.9, 63.4, 50.4, 45, 46.7, 70.3, 67.3, 57.6, 58.5, 49.5, 53.8, 40.7, 39.4, 59.8, 65.8, 41.4, 45.4, 64.5, 46.1, 62.6, 50.3, 68.8, 65.3, 45.6, 51, 44.4, 41.8, 28.3, 34.7, 64.1, 57.4, 44.1, 51.6, 63.6, 56.1, 52.7, 51.8, 71.6, 69.4, 56.6, 47.4)
)
I typed the code (blue) to create data, and asked ChatGPT to summarize mean summary data with standard error.