Transforming Data: Stacking Multiple Columns into Rows Using R
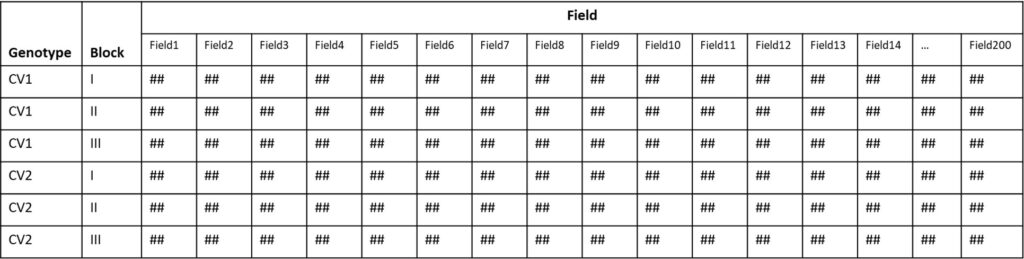
One common mistake when organizing data is collecting it as depicted below (## represents the result). While it might seem easy to input values into each column, listing data in this manner complicates statistical analysis.
To conduct statistical analysis on such listed data, it is necessary for the data to be arranged as shown below.
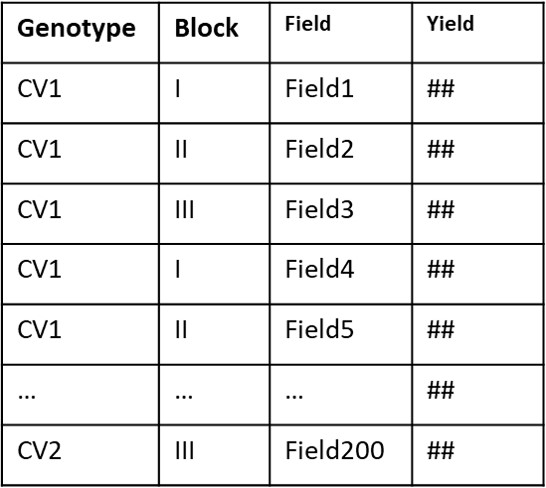
In other words, statistical analysis of an experimental design with three replicates for the two variables, Genotype and Field, can be conducted when the data is organized in rows (with each column representing a variable or a replicate).
Now, how can we transform the 200 Field data listed in columns in Excel into rows? Should we resort to manual copy-and-paste methods for data modification? One approach to eradicate these futile repetitive tasks is by utilizing the reshape2::melt() function in R, which facilitates the restructuring of the data format comprehensively in a single step.
Here is a dataset used to measure the number of grains at each spikelet in a wheat spike.
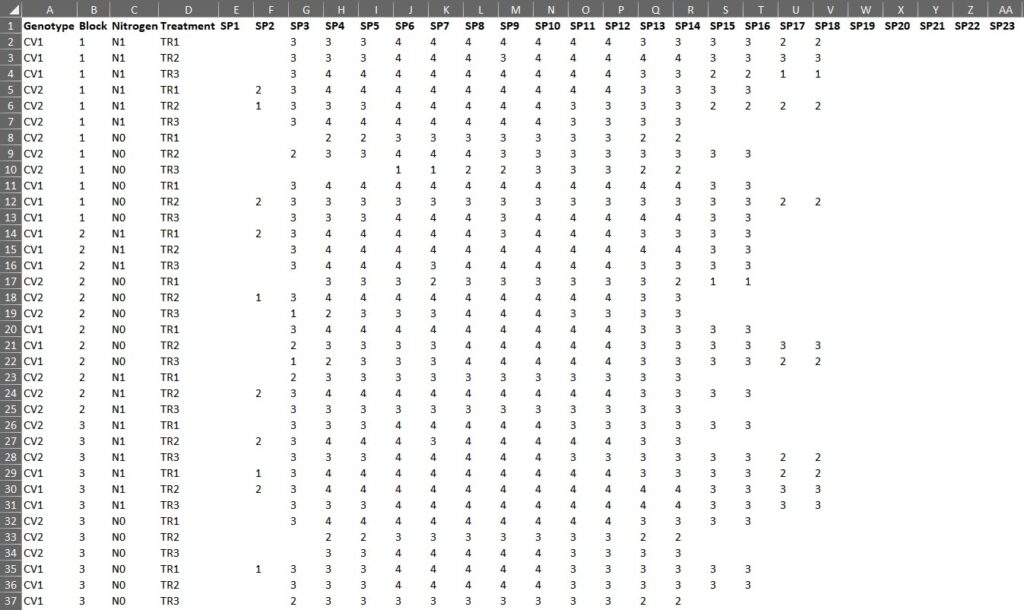
This dataset comprises three blocks, illustrating how the grain numbers differ for two treatments (Tr1, Tr2) and nitrogen level (N0, N1) across two varieties (CV1, CV2) at different spikelet positions (labeled as SP1 to SP23). If our intention is to conduct an analysis of variance to comprehend the primary effects and interactions of variety, treatment, and spikelet positions, then the data must be rearranged into columns. Resorting to manual copying and pasting is not only futile but also a time-consuming endeavor that we cannot undertake.
Now, let’s use R to rearrange the data all at once. First, let’s upload data.
install.packages("readr")
library(readr)
github= "https://raw.githubusercontent.com/agronomy4future/raw_data_practice/main/grain_number_at_spikelets.csv"
dataA= data.frame(read_csv(url(github),show_col_types = FALSE))
First, I imported the data into R. Now, I will proceed to rearrange this imported data. I will utilize the reshape2::melt() function for this purpose.
dataB= reshape2::melt(dataA[c("Genotype", "Block","Nitrogen","Treatment",
                                 "SP1","SP2","SP3","SP4","SP5","SP6",
                                 "SP7","SP8","SP9","SP10","SP11","SP12",
                                 "SP13","SP14","SP15","SP16","SP17","SP18",
                                 "SP19","SP20","SP21","SP22","SP23")],
                      id.vars=c("Genotype", "Block", "Nitrogen","Treatment"))
The instruction is to arrange all columns vertically, while distinguishing the values based on Genotype, Block, Nitrogen, and Treatment. Let’s execute the provided code.
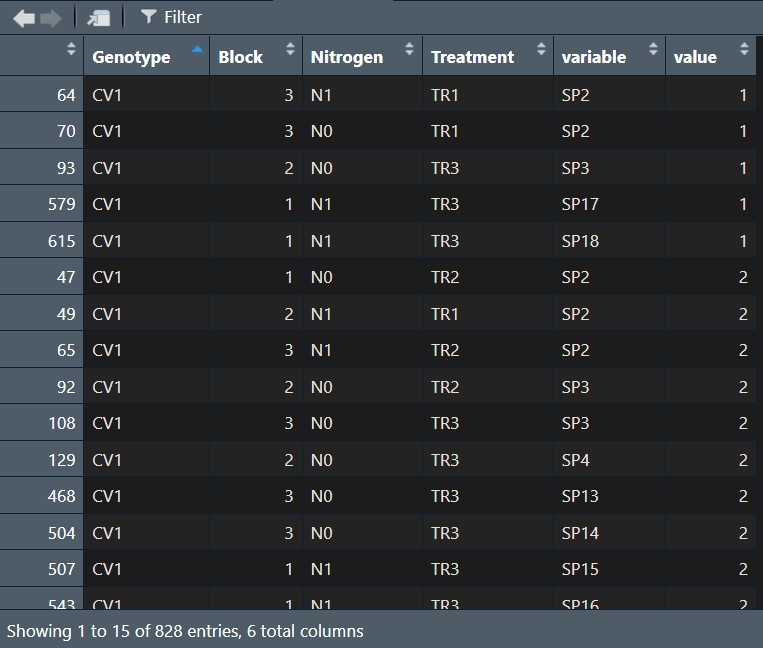
The data has been arranged in rows all at once.
Extra tip!!
If, for instance, there are columns up to 100 instead of 23, what should be done? Should each of the positions be manually included in the code? This, too, is a meaningless repetitive task. In such a scenario, the following code can be employed.
dataB= reshape2::melt(dataA[c("Genotype", "Block","Nitrogen","Treatment", paste0("SP", 1:23))], id.vars=c("Genotype", "Block", "Nitrogen","Treatment"))paste0("SP", 1:23) signifies listing from 1 to 23 after the text “SP.”
Let’s extract the rearranged data and export it to an Excel file.
install.packages("writexl")
library(writexl)
write_xlsx(dataB,"C:\\Users\\dream\\Desktop\\exporting data.xlsx")
** set up the pathway in your PC **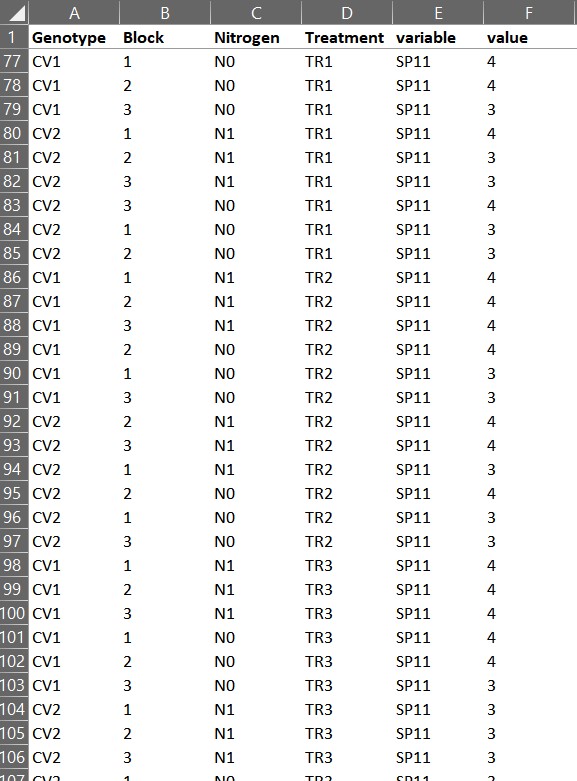
The data has been rearranged into rows in excel.
Some might ask this question: If dozens of column names are not in a sequential numeric format, but each one has a distinct name, what should be done? For example, if data is divided into columns with inconsistent independent text like Field alpha, Field beta, Field omega, and so on, what’s the approach? In such cases, you can assign your chosen numbers to each field, numbering from 1 to n, then rearrange the data into rows. Finally, replace the numbers with the corresponding field text that you designated.
Power Query is a much easier way to stack data.
Actually, for stacking data, Power Query is a much easier approach compared to writing R code. Please refer to the post below.