Creating Stacked Bar Graphs in R Studio: A Step-by-Step Guide
Today, I’ll be introducing how to create stacked bar graphs using R Studio. To start, I will generate a data table as shown below.
Genotype= c(rep(c("CV1","CV2", "CV3"), each=9))
Treatment= c(rep(c("TR1", "TR2", "TR3"), each=3),
               rep(c("TR1", "TR2", "TR3"), each=3),
               rep(c("TR1", "TR2", "TR3"), each=3))
Block= c(rep(c("B1","B2","B3"), times=9))
yield= c(rep("15",5), rep("18",5), rep("20",8), rep("14",7), rep ("21",2))
dataA= data.frame (Genotype, Treatment, Block, yield)

   Genotype Treatment Block yield
1       CV1       TR1    B1    15
2       CV1       TR1    B2    15
3       CV1       TR1    B3    15
4       CV1       TR2    B1    15
5       CV1       TR2    B2    15
6       CV1       TR2    B3    18
7       CV1       TR3    B1    18
8       CV1       TR3    B2    18
9       CV1       TR3    B3    18
10      CV2       TR1    B1    18
11      CV2       TR1    B2    20
12      CV2       TR1    B3    20
13      CV2       TR2    B1    20
14      CV2       TR2    B2    20
15      CV2       TR2    B3    20
16      CV2       TR3    B1    20
17      CV2       TR3    B2    20
18      CV2       TR3    B3    20
19      CV3       TR1    B1    14
20      CV3       TR1    B2    14
21      CV3       TR1    B3    14
22      CV3       TR2    B1    14
23      CV3       TR2    B2    14
24      CV3       TR2    B3    14
25      CV3       TR3    B1    14
26      CV3       TR3    B2    21
27      CV3       TR3    B3    21
I’ll make stacked bar graphs using this data table. First of all, it’s necessary to summarize the data. I’ll use ddply() function.
install.packages("plyr")
library (plyr)
dataA_summary= ddply (dataA, c('Genotype','Treatment'), summarise, mean=mean(yield), sd=sd(yield), n=length(yield), se=sd/sqrt(n))
If I use this code, the error message pops up
In mean.default(yield) :
  argument is not numeric or logical: returning NA
This is because when generating data, I used double quotation marks such as yield = c(rep("15", 5), rep("18", 5), rep("20", 8), rep("14", 7), rep("21", 2)), causing R to interpret this data as text. Therefore, it’s necessary to explicitly convert these values to numbers using as.numeric(yield). If you wish to avoid this step, refrain from using double quotation marks when generating the yield variable.
dataA_summary= ddply (dataA, c('Genotype','Treatment'), summarise, mean=mean(as.numeric(yield)),sd=sd(as.numeric(yield)), n=length(as.numeric(yield)), se=sd/sqrt(n))

  Genotype Treatment     mean       sd n        se
1      CV1       TR1 15.00000 0.000000 3 0.0000000
2      CV1       TR2 16.00000 1.732051 3 1.0000000
3      CV1       TR3 18.00000 0.000000 3 0.0000000
4      CV2       TR1 19.33333 1.154701 3 0.6666667
5      CV2       TR2 20.00000 0.000000 3 0.0000000
6      CV2       TR3 20.00000 0.000000 3 0.0000000
7      CV3       TR1 14.00000 0.000000 3 0.0000000
8      CV3       TR2 14.00000 0.000000 3 0.0000000
9      CV3       TR3 18.66667 4.041452 3 2.3333333
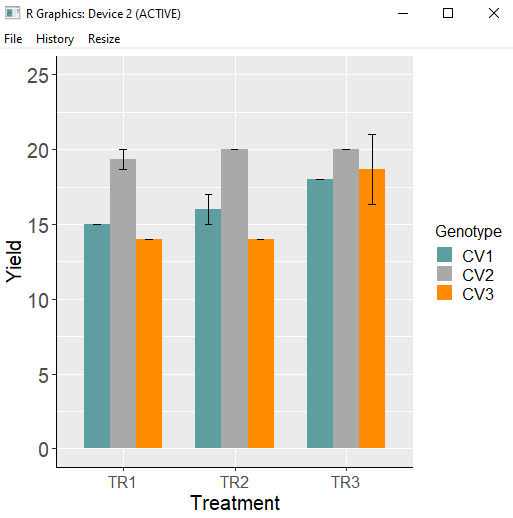
If you run the code, you will obtain this summarized data. This data includes the mean, standard deviation, and standard error. Now, let’s proceed to create a bar graph.
library (ggplot2)
ggplot(data=dataA_summary, aes(x=Treatment, y=mean, fill=Genotype))+
  geom_bar(stat="identity",position="dodge", width= 0.7, size=1) +
  geom_errorbar(aes(ymin= mean-se, ymax=mean + se), position=position_dodge(0.7),
  width=0.2, color='Black') +
  scale_fill_manual(values= c ("Cadetblue", "Dark gray","Dark orange")) +
  scale_y_continuous(breaks = seq(0,25,5), limits= c(0,25)) +
  labs(fill = "Genotype", x="Treatment", y="Yield") +
  theme(axis.title= element_text (face= "plain", size= 15, color= "black"),
        axis.text.x= element_text(size= 12),
        axis.text.y= element_text(size= 15),
        axis.line= element_line(size = 0.5, colour= "black"),
        legend.position= 'right',
        legend.key= element_rect(color= "white", fill= "white"),
        legend.key.size= unit(0.5,"cm"),
        legend.title= element_text(face= "plain", size= 12, color= "Black"),
        legend.text= element_text(face= "plain", size= 12, color= "Black"),
        strip.text.x= element_text(size= 15)) +
  windows(width=5.5, height=5)
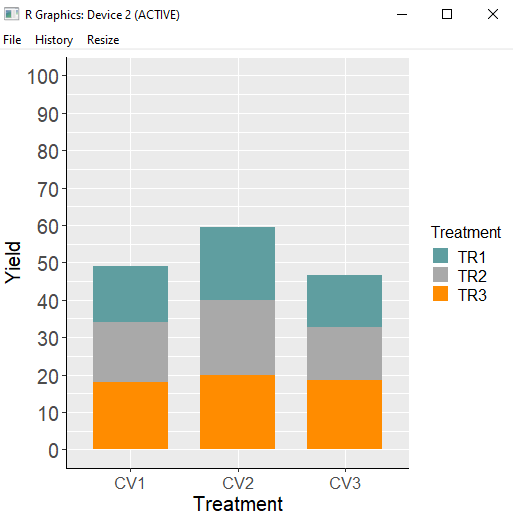
We have created a bar graph. However, now I want to create a stacked bar graph by stacking TR1 to TR3. In this case, we can achieve this by simply modifying the code: change position="dodge" to position="stack".
Furthermore, the x-axis should be labeled as “Genotype” because I aim to create a stacked bar graph based on TR per Genotype. Moreover, I’ve updated the legend’s name to “Treatment.”
ggplot(data=dataA_summary, aes(x=Genotype, y=mean, fill=Treatment))+
  geom_bar(stat="identity", position = 'stack', width= 0.7, size=1) +
  scale_fill_manual(values= c ("Cadetblue", "Dark gray","Dark orange")) +
  scale_y_continuous(breaks= seq(0,100,10), limits= c(0,100)) +
  labs(fill= "Treatment", x="Treatment", y="Yield") +
  theme(axis.title= element_text (face= "plain", size = 15, color = "black"),
        axis.text.x= element_text(size= 12),
        axis.text.y= element_text(size= 15),
        axis.line= element_line(size= 0.5, colour= "black"),
        legend.position= 'right',
        legend.key= element_rect(color= "white", fill= "white"),
        legend.key.size= unit(0.5,"cm"),
        legend.title= element_text(face= "plain", size= 12, color= "Black"),
        legend.text= element_text(face= "plain", size= 12, color= "Black"),
        strip.text.x= element_text(size= 15)) +
  windows(width=5.5, height=5)
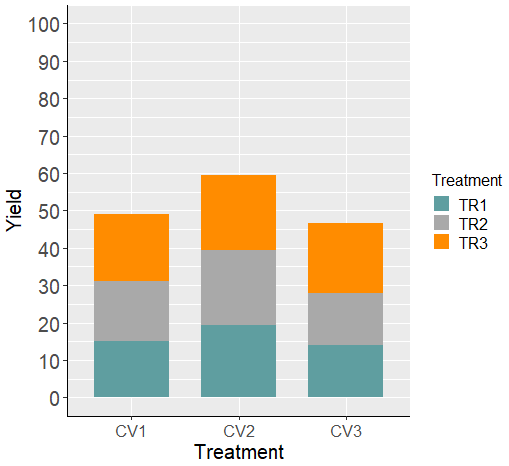
If you want to reverse the order of TR on the stacked bar graph, you can achieve that by adding the following code: position = position_stack(reverse = TRUE).
ggplot(data=dataA_summary, aes(x=Genotype, y=mean, fill=Treatment))+
 geom_bar(stat="identity", position = position_stack(reverse=T), width = 0.7, size=1) +
 scale_fill_manual(values= c ("Cadetblue", "Dark gray","Dark orange")) +
 scale_y_continuous(breaks = seq(0,100,10), limits = c(0,100)) +
 labs(fill = "Treatment", x="Treatment", y="Yield") +
 theme(axis.title = element_text (face = "plain", size = 15, color = "black"),
        axis.text.x = element_text(size= 12),
        axis.text.y = element_text(size= 15),
        axis.line = element_line(size = 0.5, colour = "black"),
        legend.position = 'right',
        legend.key = element_rect(color = "white", fill = "white"),
        legend.key.size = unit(0.5,"cm"),
        legend.title = element_text(face = "plain", size = 12, color = "Black"),
        legend.text = element_text(face = "plain", size = 12, color = "Black"),
        strip.text.x = element_text(size = 15)) +
 windows(width=5.5, height=5)