Utilizing stat_summary() in R Studio to Summarize Data Graphically
When creating graphs using data, especially those involving error bars, it is necessary to calculate the standard error by summarizing the data. There are various methods to summarize the data.
□ Utilizing R Studio for Data Grouping and Mean/Standard Error Calculation (feat ddply)
Today I will introduce a method of creating graphs all at once using stat_summary() without the need for such data summarization.
Below is an example dataset:
Genotype= c(rep(c("CV1","CV2"),each=20))
position= rep(paste(1:20),times=2)
Block= c(rep(c("I","II","III"),each=40))
number= c(2,3,3,3,3,3,4,4,4,4,4,4,4,3,3,4,3,2,2,2,
          3,3,3,3,4,3,3,3,4,5,4,3,4,5,3,3,3,2,3,1,
          1,3,4,3,2,3,3,3,4,4,5,4,3,3,3,2,3,2,2,3,
          2,3,4,3,2,3,4,4,4,4,4,4,4,3,3,3,3,2,1,1,
          2,3,3,3,2,2,5,3,4,5,4,5,4,3,2,5,4,2,2,2,
          1,3,3,3,4,3,3,4,4,4,4,3,4,3,2,1,3,2,4,2)
dataA= data.frame(Genotype,position,Block,number)
dataA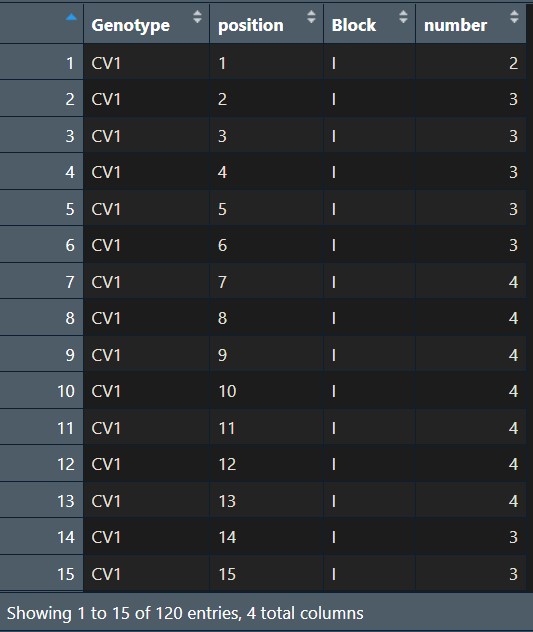
Now I want to display the data as points by placing the x-axis at “position” and the y-axis at “number.”
library(ggplot2)
ggplot(data=dataA) +
  stat_summary(aes(x=as.numeric(position), y=as.numeric(number), fill=Genotype,
                   shape=Genotype), geom="point", fun = mean, col="Black", size=5)+
  scale_fill_manual(values= c("black","red")) +
  scale_shape_manual(values= c(21,22)) +
  scale_x_continuous(breaks= seq(0,21,2),limits= c(0,21)) +
  scale_y_continuous(breaks= seq(0,5,1),limits= c(0,5)) +
  labs(fill= "Genotype", x="Position", y='Grain number') +
  theme_classic(base_size=20, base_family="serif")+
  theme(legend.position=c(0.90,0.12),,
        legend.title=element_blank(),
        legend.key.size=unit(0.5,'cm'),
        legend.key=element_rect(color=alpha("white",.05),
                                fill=alpha("white",.05)),
        legend.text=element_text(size=11),
        legend.background= element_rect(fill=alpha("white",.05)),
        panel.grid.major=element_line(colour="grey90", linewidth=0.5),
        axis.line=element_line(linewidth=0.5, colour="black")) +
windows(width=5.5, height=5) 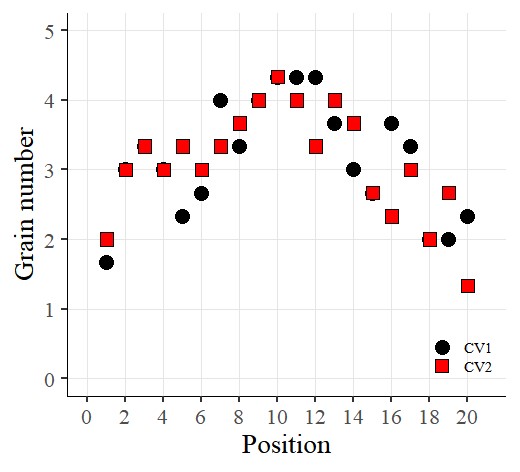
I’ve created the graph like above.
Now I want to add error bars. So, I’ll insert the following code:
library(ggplot2)
ggplot(data=dataA) +
  stat_summary(aes(x=as.numeric(position), y=as.numeric(number), fill=Genotype,
                   shape=Genotype), geom="point", fun= mean, col="Black", size=5)+
  stat_summary(aes(x=as.numeric(position), y=as.numeric(number), group=Genotype),
               geom="errorbar", col="Black", width=.8)+
  scale_fill_manual(values= c("black","red")) +
  scale_shape_manual(values= c(21,22)) +
  scale_x_continuous(breaks= seq(0,21,2),limits= c(0,21)) +
  scale_y_continuous(breaks= seq(0,5,1),limits= c(0,5)) +
  labs(fill= "Genotype", x="Position", y='Grain number') +
  theme_classic(base_size=20, base_family="serif")+
  theme(legend.position=c(0.90,0.12),,
        legend.title=element_blank(),
        legend.key.size=unit(0.5,'cm'),
        legend.key=element_rect(color=alpha("white",.05),
                                fill=alpha("white",.05)),
        legend.text=element_text(size=11),
        legend.background= element_rect(fill=alpha("white",.05)),
        panel.grid.major=element_line(colour="grey90", linewidth=0.5),
        axis.line=element_line(linewidth=0.5, colour="black")) +
windows(width=5.5, height=5) 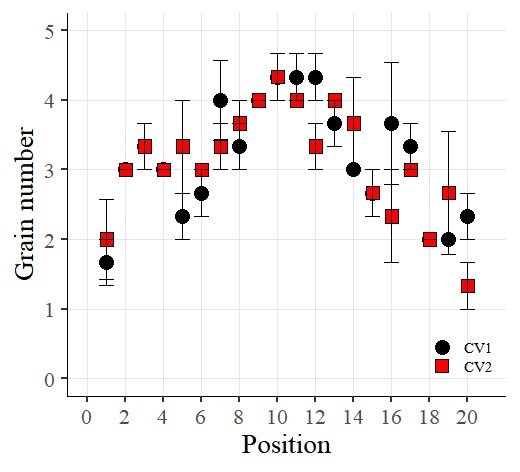
I want to connect the points with lines. So, I’ll add the following code:
library(ggplot2)
ggplot(data=dataA) +
  stat_summary(aes(x=as.numeric(position), y=as.numeric(number), fill=Genotype,
                   shape=Genotype), geom="point", fun = mean, col="Black", size=5)+
  stat_summary(aes(x=as.numeric(position), y=as.numeric(number), group=Genotype),
               geom="errorbar", col="Black", width=.8)+
  stat_summary(aes(x=as.numeric(position), y=as.numeric(number), group=Genotype),
               geom="line", fun= mean, lty="dashed")+
  scale_fill_manual(values= c("black","red")) +
  scale_shape_manual(values= c(21,22)) +
  scale_x_continuous(breaks= seq(0,21,2),limits = c(0,21)) +
  scale_y_continuous(breaks= seq(0,5,1),limits = c(0,5)) +
  labs(fill= "Genotype", x="Position", y='Grain number') +
  theme_classic(base_size=20, base_family="serif")+
  theme(legend.position=c(0.90,0.12),,
        legend.title=element_blank(),
        legend.key.size=unit(0.5,'cm'),
        legend.key=element_rect(color=alpha("white",.05),
                                fill=alpha("white",.05)),
        legend.text=element_text(size=11),
        legend.background= element_rect(fill=alpha("white",.05)),
        panel.grid.major=element_line(colour="grey90", linewidth=0.5),
        axis.line=element_line(linewidth=0.5, colour="black")) +
windows(width=5.5, height=5)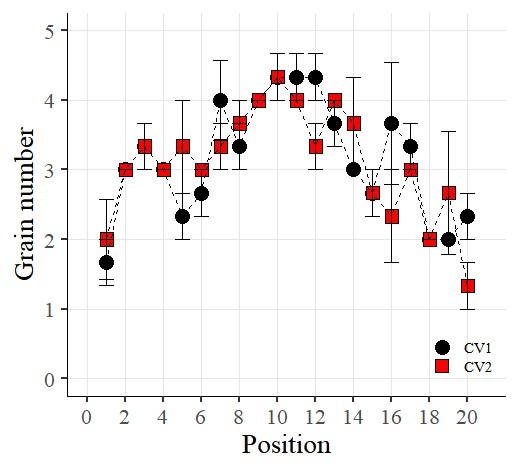
Now I want to rotate the graph. So, I’ll add the following code using coord_flip()
library(ggplot2)
ggplot(data=dataA) +
  stat_summary(aes(x=as.numeric(position), y=as.numeric(number), fill=Genotype,
                   shape=Genotype), geom="point", fun = mean, col="Black", size=5)+
  stat_summary(aes(x=as.numeric(position), y=as.numeric(number), group=Genotype),
               geom="errorbar", col="Black", width=.8)+
  stat_summary(aes(x=as.numeric(position), y=as.numeric(number), group=Genotype),
               geom="line", fun= mean, lty="dashed")+
  scale_fill_manual(values= c("black","red")) +
  scale_shape_manual(values= c(21,22)) +
  scale_x_continuous(breaks= seq(0,21,2),limits = c(0,21)) +
  scale_y_continuous(breaks= seq(0,5,1),limits = c(0,5)) +
  coord_flip() +
  labs(fill= "Genotype", x="Position", y='Grain number') +
  theme_classic(base_size=20, base_family="serif")+
  theme(legend.position=c(0.90,0.12),,
        legend.title=element_blank(),
        legend.key.size=unit(0.5,'cm'),
        legend.key=element_rect(color=alpha("white",.05),
                                fill=alpha("white",.05)),
        legend.text=element_text(size=11),
        legend.background= element_rect(fill=alpha("white",.05)),
        panel.grid.major=element_line(colour="grey90", linewidth=0.5),
        axis.line=element_line(linewidth=0.5, colour="black")) +
windows(width=5.5, height=5) 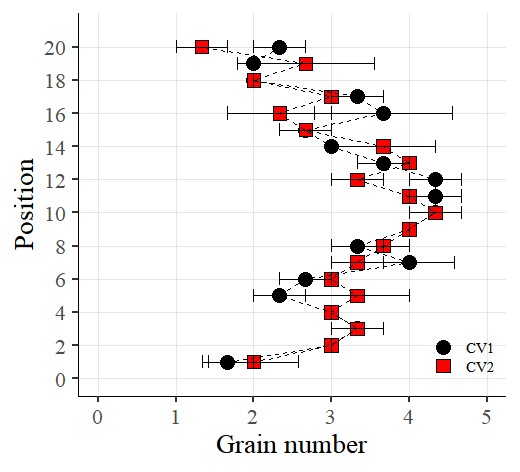

© 2022 – 2023 https://agronomy4future.com