Graph Partitioning Using facet_wrap() in R Studio
While creating graphs, you can certainly draw multiple graphs in a single panel. However, you can also use the facet_wrap() function to divide graphs based on specific variables.
First, let’s generate a dataset.
Nitrogen= c(rep("N0", 5), rep("N1", 5))
Cultivar_1= c(50,49,48,47,46,60,62,63,64,62)
Cultivar_2= c(55,57,56,55,54,65,66,67,64,63)
Cultivar_3= c(60,62,63,65,59,60,59,57,56,58)
dataA= data.frame(Nitrogen, Cultivar_1, Cultivar_2, Cultivar_3)

   Nitrogen Cultivar_1 Cultivar_2 Cultivar_3
1        N0         50         55         60
2        N0         49         57         62
3        N0         48         56         63
4        N0         47         55         65
5        N0         46         54         59
6        N1         60         65         60
7        N1         62         66         59
8        N1         63         67         57
9        N1         64         64         56
10       N1         62         63         58
I intend to create a bar graph using this data. Therefore, I need to summarize the data. To do this, I must reorganize the data from being divided into columns to being arranged in rows.
dataB= reshape2::melt(dataA[c("Nitrogen","Cultivar_1","Cultivar_2", "Cultivar_3")], id.vars=c("Nitrogen"))

   Nitrogen   variable value
1        N0 Cultivar_1    50
2        N0 Cultivar_1    49
3        N0 Cultivar_1    48
4        N0 Cultivar_1    47
5        N0 Cultivar_1    46
6        N1 Cultivar_1    60
7        N1 Cultivar_1    62
8        N1 Cultivar_1    63
9        N1 Cultivar_1    64
10       N1 Cultivar_1    62
11       N0 Cultivar_2    55
12       N0 Cultivar_2    57
13       N0 Cultivar_2    56
14       N0 Cultivar_2    55
15       N0 Cultivar_2    54
16       N1 Cultivar_2    65
17       N1 Cultivar_2    66
18       N1 Cultivar_2    67
19       N1 Cultivar_2    64
20       N1 Cultivar_2    63
21       N0 Cultivar_3    60
22       N0 Cultivar_3    62
23       N0 Cultivar_3    63
24       N0 Cultivar_3    65
25       N0 Cultivar_3    59
26       N1 Cultivar_3    60
27       N1 Cultivar_3    59
28       N1 Cultivar_3    57
29       N1 Cultivar_3    56
30       N1 Cultivar_3    58
I have reorganized the data into rows using the reshape2::melt() function. Now, let’s proceed to summarize this data. I will be using the dplyr package for this purpose.
library (dplyr)
dataC= data.frame(dataB %>%
  group_by(Nitrogen, variable) %>%
  summarise(mean=mean(value), sd=sd(value), n=length(value), se=sd/sqrt(n)))

  Nitrogen   variable mean       sd n        se
1       N0 Cultivar_1 48.0 1.581139 5 0.7071068
2       N0 Cultivar_2 55.4 1.140175 5 0.5099020
3       N0 Cultivar_3 61.8 2.387467 5 1.0677078
4       N1 Cultivar_1 62.2 1.483240 5 0.6633250
5       N1 Cultivar_2 65.0 1.581139 5 0.7071068
6       N1 Cultivar_3 58.0 1.581139 5 0.7071068
The data has been summarized as follows: The average and standard error of the yield for three varieties based on Nitrogen treatment (N0, N1) have been summarized. With this data, let’s proceed to create a bar graph.
library(ggplot2)
ggplot (data=dataC, aes(x=variable, y=mean, fill=Nitrogen)) +
  geom_bar(stat="identity",position="dodge") +
  geom_errorbar(aes(ymin= mean-se, ymax=mean+se), position=position_dodge(0.9),
  width=0.2) +
  scale_y_continuous(breaks= seq(0, 70, 10), limits= c(0, 70))+
  scale_fill_manual(values= c("Gray","Dark green")) +
  labs(fill="Nitrogen", x="Cultivar", y="Yield") +
  theme(axis.title= element_text (face= "plain", size= 17, color= "black"),
        axis.text.x= element_text(size= 15),
        axis.text.y= element_text(size= 15),
        axis.line= element_line(size= 0.5, colour= "black"),
        legend.position= 'bottom',
        legend.key= element_rect(color= "white", fill= "white"),
        legend.key.size= unit(0.5,"cm"),
        legend.title= element_text(face="plain", size= 14, color= "Black"),
        legend.text= element_text(face="plain", size= 14, color= "Black"),
        strip.text.x= element_text(size=17),
        plot.margin=unit(c(0.5,0.5,0.5,0.5),"cm")) +
   windows(width=5.5, height=5)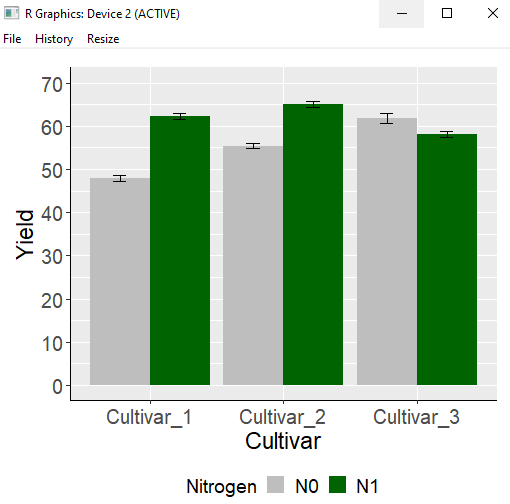
I have created the bar graph. I used aes(x=variable, y=mean, fill=Nitrogen) and assigned Nitrogen to the fill aesthetic. As a result, in a single graph panel, two bar graphs are displayed for each cultivar based on the Nitrogen factor. However, instead of this approach, I would like to create individual bar graphs for each Nitrogen level. Rather than plotting graphs in separate panels, I can use the facet_wrap() function to divide the graphs in a single panel.
Adding the facet_wrap(~Nitrogen) code to the existing code will divide the graphs based on the variable Nitrogen.
ggplot (data=dataC, aes(x=variable, y=mean, fill=Nitrogen)) +
  geom_bar(stat="identity",position="dodge") +
  geom_errorbar(aes(ymin= mean- se, ymax=mean + se),
                position=position_dodge(0.9), width=0.2) +
  scale_fill_manual(values= c("Gray","Dark green")) +
  scale_y_continuous(breaks= seq(0, 70, 10), limits= c(0, 70))+
  facet_wrap(~Nitrogen) +
  labs(fill="Nitrogen", x="Cultivar", y="Yield") +
  theme(axis.title= element_text (face= "plain", size= 17, color= "black"),
        axis.text.x= element_text(size= 15),
        axis.text.y= element_text(size= 15),
        axis.line= element_line(size= 0.5, colour= "black"),
        legend.position= 'bottom',
        legend.key= element_rect(color= "white", fill= "white"),
        legend.key.size= unit(0.5,"cm"),
        legend.title= element_text(face="plain", size= 14, color= "Black"),
        legend.text= element_text(face="plain", size= 14, color= "Black"),
        strip.text.x= element_text(size=17),
        plot.margin=unit(c(0.5,0.5,0.5,0.5),"cm")) +
  windows(width=7, height=5)
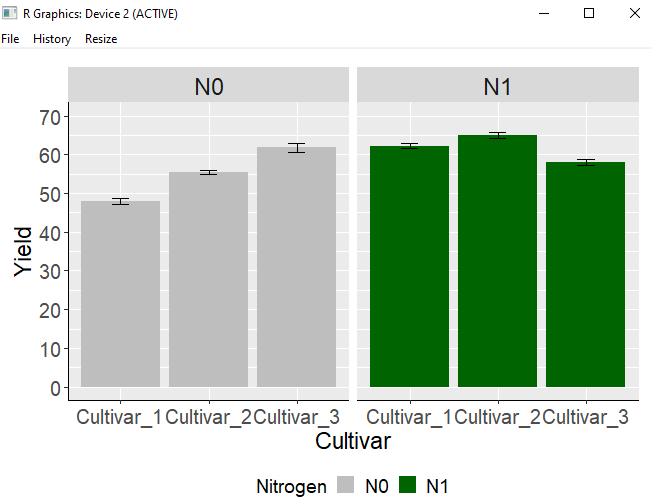
Then, you will be able to obtain a graph similar to the one described above.
Extra tips!!!
1) Adjusting the size of titles in panels
strip.text.x= element_text(size=17) By adding the above code to the complete set of code, you can modify the size of the label titles.
2) Changing the name of labels
newLable= c("Low Nitrogen", "High Nitrogen")
names(newLable)= c("N0", "N1")
In this manner, a code is prepared beforehand to change N0 and N1 to “Low Nitrogen” and “High Nitrogen” before generating the ggplot, and Insert the labeller=labeller(Nitrogen=newLabel) code inside the facet_wrap() code.
you would write the code as follows:
newLable= c("Low Nitrogen", "High Nitrogen")
names(newLable)= c("N0", "N1")
##
ggplot (data=dataC, aes(x=variable, y=mean, fill=Nitrogen)) +
  geom_bar(stat="identity",position="dodge") +
  geom_errorbar(aes(ymin= mean- se, ymax=mean + se), position=position_dodge(0.9),
                width=0.2) +
  scale_fill_manual(values= c("Gray","Dark green")) +
  scale_y_continuous(breaks= seq(0, 70, 10), limits= c(0, 70))+
  facet_wrap(~Nitrogen, labeller=labeller(Nitrogen=newLable)) +
  labs(fill="Nitrogen", x="Cultivar", y="Yield") +
  theme(axis.title= element_text (face= "plain", size= 17, color= "black"),
        axis.text.x= element_text(size= 15),
        axis.text.y= element_text(size= 15),
        axis.line= element_line(size= 0.5, colour= "black"),
        legend.position= 'bottom',
        legend.key= element_rect(color= "white", fill= "white"),
        legend.key.size= unit(0.5,"cm"),
        legend.title= element_text(face="plain", size= 14, color= "Black"),
        legend.text= element_text(face="plain", size= 14, color= "Black"),
        strip.text.x= element_text(size=25),
        plot.margin=unit(c(0.5,0.5,0.5,0.5),"cm")) +
  windows(width=7, height=5)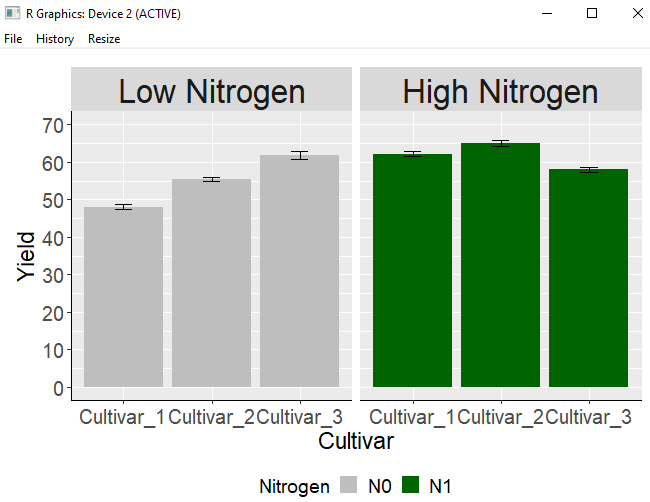
Another approach is to directly change the variable names in the data table. This is the method to modify the variable names within the Nitrogen column of the dataC dataset. I will change N0 to “0kg Nitrogen” and N1 to “200kg Nitrogen”.
  Nitrogen   variable mean       sd n        se
1       N0 Cultivar_1 48.0 1.581139 5 0.7071068
2       N0 Cultivar_2 55.4 1.140175 5 0.5099020
3       N0 Cultivar_3 61.8 2.387467 5 1.0677078
4       N1 Cultivar_1 62.2 1.483240 5 0.6633250
5       N1 Cultivar_2 65.0 1.581139 5 0.7071068
6       N1 Cultivar_3 58.0 1.581139 5 0.7071068

dataC$Nitrogen= factor(dataC$Nitrogen , levels = c("N0", "N1"),
                labels= c("0kg Nitrogen", "200kg High Nitrogen"))
Once the code runs, you will notice that the title names have been changed.
ggplot (data=dataC, aes(x=variable, y=mean, fill=Nitrogen)) +
  geom_bar(stat="identity",position="dodge") +
  geom_errorbar(aes(ymin= mean- se, ymax=mean + se), position=position_dodge(0.9),
                width=0.2) +
  scale_fill_manual(values= c("Gray","Dark green")) +
  scale_y_continuous(breaks= seq(0, 70, 10), limits= c(0, 70))+
  facet_wrap(~Nitrogen) +
  labs(fill="Nitrogen", x="Cultivar", y="Yield") +
  theme(axis.title= element_text (face= "plain", size= 17, color= "black"),
        axis.text.x= element_text(size= 15),
        axis.text.y= element_text(size= 15),
        axis.line= element_line(size= 0.5, colour= "black"),
        legend.position= 'bottom',
        legend.key= element_rect(color= "white", fill= "white"),
        legend.key.size= unit(0.5,"cm"),
        legend.title= element_text(face="plain", size= 14, color= "Black"),
        legend.text= element_text(face="plain", size= 14, color= "Black"),
        strip.text.x= element_text(size=15),
        plot.margin=unit(c(0.5,0.5,0.5,0.5),"cm")) +
  windows(width=7, height=5)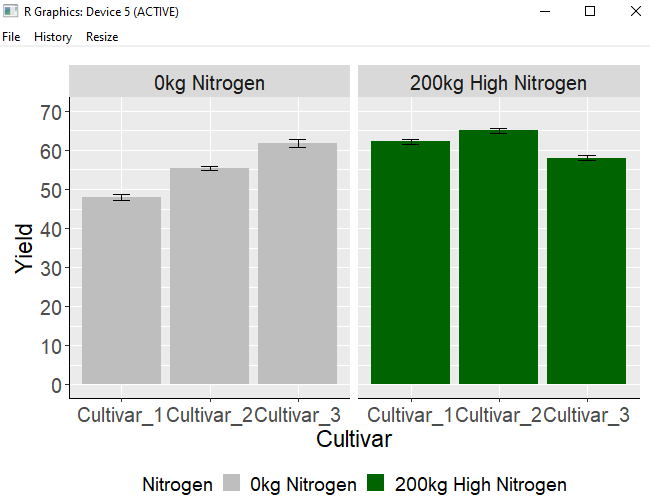
Another method is to use the stringr package to change the variable names within a column. If you execute the below code, you will be able to observe that the label names have been altered.
library (stringr)
dataC$Nitrogen= str_replace_all (dataC$Nitrogen, 'N0', 'No Fertilizer')
dataC$Nitrogen= str_replace_all (dataC$Nitrogen, 'N1', 'Fertilizer')
3) Filling the label colors
strip.background= element_rect(color="Red", fill="Yellow", size=2, linetype="solid")Insert the above code. The label’s border color is red, the fill color is yellow, the border size is 2, and the border line is set to be solid.
ggplot (data=dataC, aes(x=variable, y=mean, fill=Nitrogen)) +
  geom_bar(stat="identity",position="dodge") +
  geom_errorbar(aes(ymin= mean- se, ymax=mean + se),
                position=position_dodge(0.9), width=0.2) +
  scale_fill_manual(values= c("Gray","Dark green")) +
  scale_y_continuous(breaks= seq(0, 70, 10), limits= c(0, 70))+
  facet_wrap(~Nitrogen) +
  labs(fill="Nitrogen", x="Cultivar", y="Yield") +
  theme(axis.title= element_text (face= "plain", size= 17, color= "black"),
        axis.text.x= element_text(size= 15),
        axis.text.y= element_text(size= 15),
        axis.line= element_line(size= 0.5, colour= "black"),
        legend.position= 'bottom',
        legend.key= element_rect(color= "white", fill= "white"),
        legend.key.size= unit(0.5,"cm"),
        legend.title= element_text(face="plain", size= 14, color= "Black"),
        legend.text= element_text(face="plain", size= 14, color= "Black"),
        strip.text.x= element_text(size=15),
        strip.background = element_rect(color="Red", fill="Yellow", size=2,
        linetype="solid"),
        plot.margin=unit(c(0.5,0.5,0.5,0.5),"cm")) +
  windows(width=7, height=5)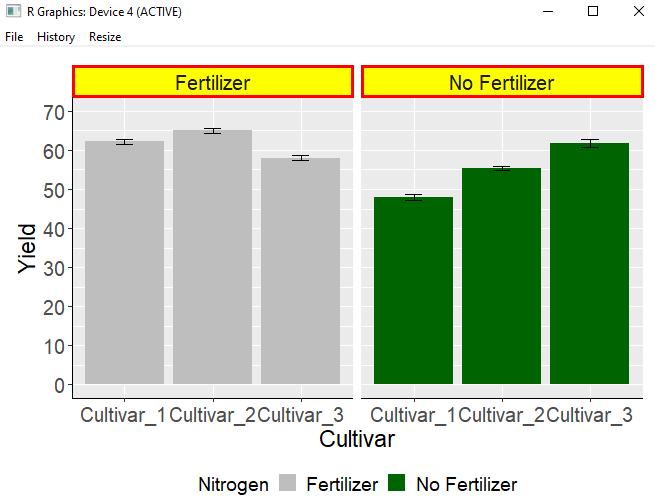
# full code
library (dplyr)
library (stringr)
library(ggplot2)

Nitrogen= c(rep("N0", 5), rep("N1", 5))
Cultivar_1= c(50,49,48,47,46,60,62,63,64,62)
Cultivar_2= c(55,57,56,55,54,65,66,67,64,63)
Cultivar_3= c(60,62,63,65,59,60,59,57,56,58)
dataA= data.frame(Nitrogen, Cultivar_1, Cultivar_2, Cultivar_3)

dataB= reshape2::melt(dataA[c("Nitrogen","Cultivar_1","Cultivar_2", "Cultivar_3")],
                      id.vars=c("Nitrogen"))

dataC= data.frame(dataB %>%
                    group_by(Nitrogen, variable) %>%
                    summarise(mean=mean(value), sd=sd(value), n=length(value), se=sd/sqrt(n)))

dataC$Nitrogen= str_replace_all (dataC$Nitrogen, 'N0', 'No Fertilizer')
dataC$Nitrogen= str_replace_all (dataC$Nitrogen, 'N1', 'Fertilizer')

ggplot (data=dataC, aes(x=variable, y=mean, fill=Nitrogen)) +
  geom_bar(stat="identity",position="dodge") +
  geom_errorbar(aes(ymin= mean- se, ymax=mean + se),
                position=position_dodge(0.9), width=0.2) +
  scale_fill_manual(values= c("Gray","Dark green")) +
  scale_y_continuous(breaks= seq(0, 70, 10), limits= c(0, 70))+
  facet_wrap(~Nitrogen) +
  labs(fill="Nitrogen", x="Cultivar", y="Yield") +
  theme(axis.title= element_text (face= "plain", size= 17, color= "black"),
        axis.text.x= element_text(size= 15),
        axis.text.y= element_text(size= 15),
        axis.line= element_line(size= 0.5, colour= "black"),
        legend.position= 'bottom',
        legend.key= element_rect(color= "white", fill= "white"),
        legend.key.size= unit(0.5,"cm"),
        legend.title= element_text(face="plain", size= 14, color= "Black"),
        legend.text= element_text(face="plain", size= 14, color= "Black"),
        strip.text.x= element_text(size=15),
        strip.background = element_rect(color="Red", fill="Yellow", size=2,
                                        linetype="solid"),
        plot.margin=unit(c(0.5,0.5,0.5,0.5),"cm")) +
  windows(width=7, height=5)
<full code access available> https://github.com/agronomy4future/r_code/blob/main/facet_wrap
