Exploring Axis Title and Text Spacing Adjustment in R Studio for Graphs
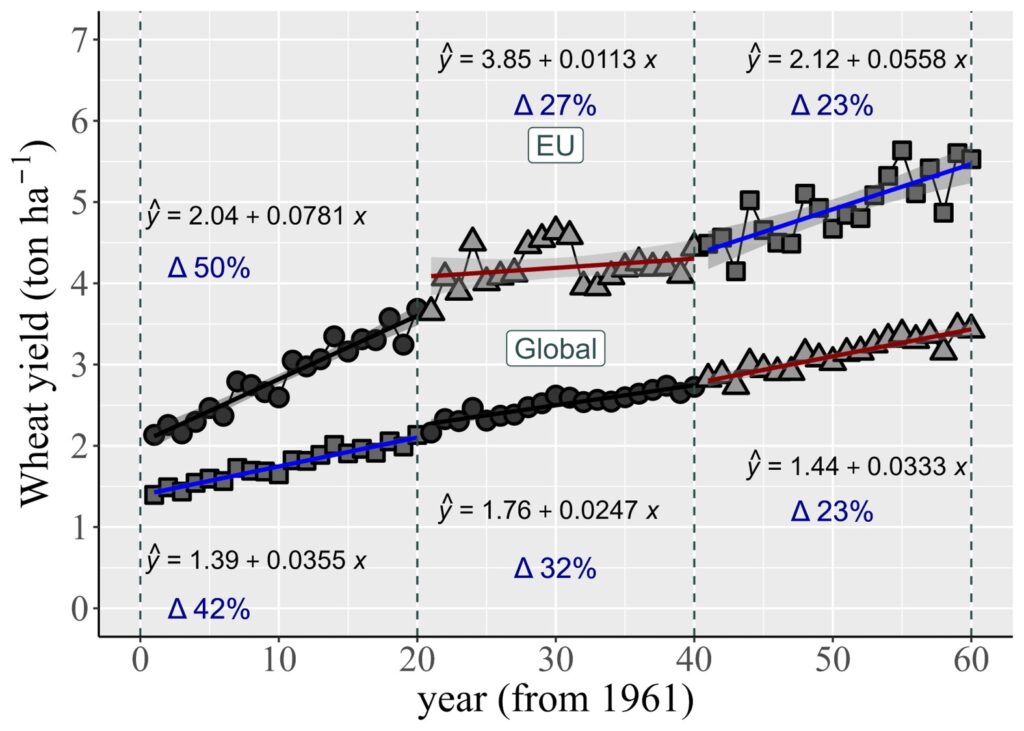
If you visit FAOSTAT (https://www.fao.org/faostat/en/), you can download high-quality data related to agriculture. Recently, I conducted an analysis of the trends in global and European wheat harvest quantities. As a result, I performed data analysis similar to the following.

The complete code for the above graph is as follows:
## full code

library(readr)
library(ggpmisc)
library (dplyr)

github= "https://raw.githubusercontent.com/agronomy4future/raw_data_practice/main/wheat_yield_trend_over_60_years_by_faostat.csv"
dataA= data.frame(read_csv(url(github),show_col_types = FALSE))
dataA= subset(dataA, location!="S.Korea" & location!="Canada" & location!="US")

dataB= data.frame(dataA %>%
                  group_by(location, trend, year_count) %>%
                  summarise(mean=mean(yield), sd=sd(yield),
                  n=length(yield), se=sd/sqrt(n)))

Fig1= ggplot(data=dataB, aes(x=year_count, y=mean, group1=location)) +
  geom_line(size=0.5,linetype="solid") +
  geom_point(aes(fill=trend, shape=trend),size=3.5, stroke = 1.2) +
  geom_smooth(aes(fill=trend, color=trend), method= lm, level=0.95,
              se=TRUE, linetype=1, size=1, formula= y ~ x) +
  ## to adjust color
  scale_shape_manual(values= c(21,22,24,21,22,24)) +
  scale_fill_manual(values= rep(c("grey20","grey40","grey60"),2)) +
  scale_color_manual(values= rep(c("Black","Blue","Dark red"),2)) +
  ## to set up unit on axis
  scale_x_continuous(breaks= seq(0,60,10),limits = c(0,60)) +
  scale_y_continuous(breaks= seq(0,7,1),limits = c(0,7)) +
  ## to draw line
  geom_vline(xintercept = 20, linetype= "dashed", color="Darkslategray") +
  geom_vline(xintercept = 40, linetype= "dashed", color="Darkslategray") +
  geom_vline(xintercept = 0, linetype= "dashed", color="Darkslategray") +
  geom_vline(xintercept = 60, linetype= "dashed", color="Darkslategray") +
  ## to add text
  geom_label(aes(fontface=6), x=30, y=3.2, label="Global", size=5, fill="White", col="Darkslategray") +
  geom_label(aes(fontface=6), x=30, y=5.7, label="EU", size=5, fill="White", col="Darkslategray") +
  geom_text(aes(fontface=6), x=5, y=4.2, label="Δ 50%", size=5, col="Dark blue") +
  geom_text(aes(fontface=6), x=30, y=6.2, label="Δ 27%", size=5, col="Dark blue") +
  geom_text(aes(fontface=6), x=50, y=6.2, label="Δ 23%", size=5, col="Dark blue") +
  geom_text(aes(fontface=6), x=5, y=0, label="Δ 42%", size=5, col="Dark blue") +
  geom_text(aes(fontface=6), x=30, y=0.5, label="Δ 32%", size=5, col="Dark blue") +
  geom_text(aes(fontface=6), x=50, y=1.2, label="Δ 23%", size=5, col="Dark blue") +
  ## to add linear equation
  stat_poly_eq(data=subset(dataB, trend=="1STEU"),
               aes(label= paste(..eq.label.., sep = "~~~")), label.x.npc= 0.05,
               label.y.npc = 0.7, eq.with.lhs= "italic(hat(y))~'='~",
               eq.x.rhs= "~italic(x)", coef.digits= 3, formula = y ~ x, parse= TRUE, size= 4.5) +
  stat_poly_eq(data=subset(dataB, trend=="2NDEU"),
               aes(label= paste(..eq.label.., sep = "~~~")), label.x.npc= 0.37,
               label.y.npc = 0.95, eq.with.lhs= "italic(hat(y))~'='~",
               eq.x.rhs= "~italic(x)", coef.digits= 3, formula = y ~ x, parse= TRUE, size= 4.5) +
  stat_poly_eq(data=subset(dataB, trend=="3RDEU"),
               aes(label= paste(..eq.label.., sep = "~~~")), label.x.npc= 0.95,
               label.y.npc= 0.95, eq.with.lhs= "italic(hat(y))~'='~",
               eq.x.rhs= "~italic(x)", coef.digits= 3, formula= y ~ x, parse= TRUE, size= 4.5) +
  stat_poly_eq(data=subset(dataB, trend=="1STWorld"),
               aes(label= paste(..eq.label.., sep= "~~~")), label.x.npc= 0.05,
               label.y.npc = 0.1, eq.with.lhs= "italic(hat(y))~'='~",
               eq.x.rhs= "~italic(x)", coef.digits= 3, formula= y ~ x, parse= TRUE, size= 4.5) +
  stat_poly_eq(data=subset(dataB, trend=="2NDWorld"),
               aes(label= paste(..eq.label.., sep = "~~~")), label.x.npc= 0.37,
               label.y.npc= 0.18, eq.with.lhs= "italic(hat(y))~'='~",
               eq.x.rhs= "~italic(x)", coef.digits= 3, formula= y ~ x, parse= TRUE, size= 4.5) +
  stat_poly_eq(data=subset(dataB, trend=="3RDWorld"),
               aes(label= paste(..eq.label.., sep = "~~~")), label.x.npc= 0.95,
               label.y.npc = 0.25, eq.with.lhs= "italic(hat(y))~'='~",
               eq.x.rhs = "~italic(x)", coef.digits= 3, formula= y ~ x, parse= TRUE, size= 4.5) +
  ## to add axis titles
  ylab(bquote("Wheat yield (ton" ~ ha^-1*')')) +
  labs(x="year (from 1961)") +
  ## theme
  theme(axis.title.x= element_text (family="serif", face= "plain", size= 20, color= "Black"),
        axis.title.y= element_text (family="serif", face= "plain", size= 20, color= "Black"),
        axis.text.x= element_text(family="serif", size=18),
        axis.text.y= element_text(family="serif", size=18),
        axis.line= element_line(size= 0.5, colour= "black"),
        legend.position= "none",
        legend.key= element_rect(color= NULL, fill= alpha("grey",.05)),
        legend.key.size= unit(0.5,"cm"),
        legend.background= element_rect(fill= alpha("grey",.05)),
        legend.title= element_text(family="serif", face= "plain", size= 16, color= "Black"),
        legend.text= element_text(family="serif", face= "plain", size= 16, color= "Black"))
Fig1 + windows(width=7, height=5)

ggsave("C:/***/***/***/***/Fig1.jpg",
       Fig1, width=17.78, height=12.7, units="cm", dpi=1000)

→ to set up the pathway to save file; Ctrl + Shift + H
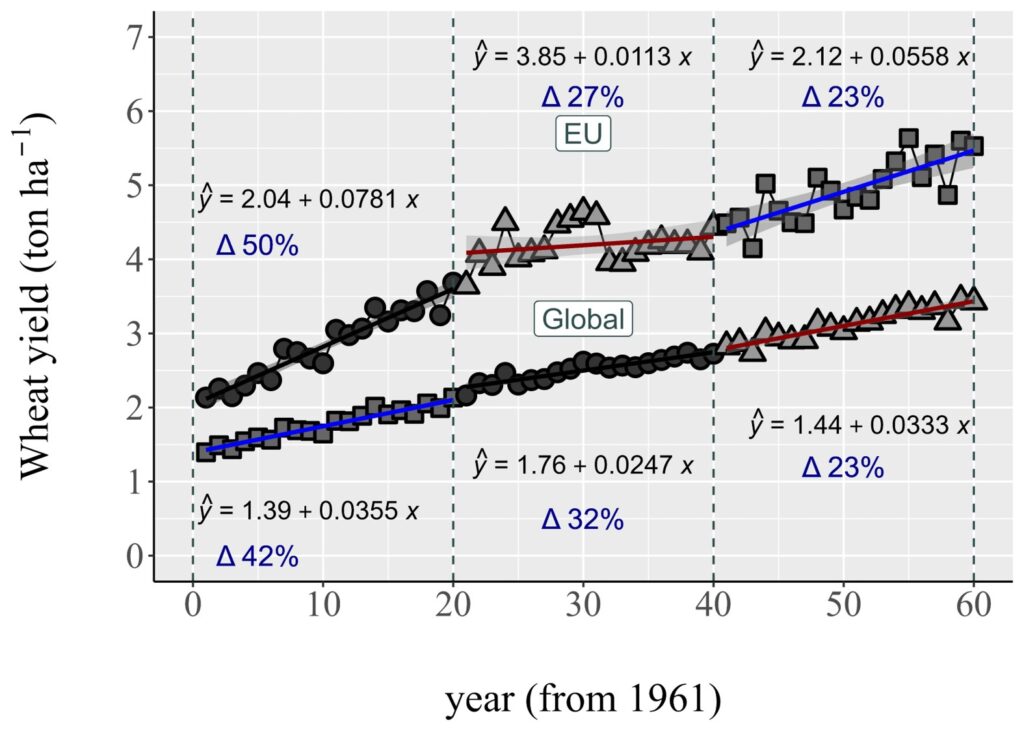
In the above graph, it seems that the axis title labels are too close to the axis text. I’d like to increase the spacing a bit. From now on, I’ll be discussing the axis title labels and text. Therefore, I’ll use only the code below to illustrate my points.
theme(axis.title.x= element_text (family="serif", face= "plain", size= 20, color= "Black"),
        axis.title.y= element_text (family="serif", face= "plain", size= 20, color= "Black"),
        axis.text.x= element_text(family="serif", size=18),
        axis.text.y= element_text(family="serif", size=18),
        axis.line= element_line(size= 0.5, colour= "black"),
        legend.position= "none",
        legend.key= element_rect(color= NULL, fill= alpha("grey",.05)),
        legend.key.size= unit(0.5,"cm"),
        legend.background= element_rect(fill= alpha("grey",.05)),
        legend.title= element_text(family="serif", face= "plain", size= 16, color= "Black"),
        legend.text= element_text(family="serif", face= "plain", size= 16, color= "Black"))
1) Adjusting the spacing of the x-y axis title labels in the graph.
You can place the code margin= margin(t=#, r=#, b=#, l=#) within axis.title.x and axis.title.y. Here, ‘t’ represents the top, ‘r’ stands for right, ‘b’ is for the bottom, and ‘l’ signifies the left. To increase the spacing between the axis titles and the axis text, you can adjust the top margin for the x-axis and the right margin for the y-axis.
theme(axis.title.x= element_text (family="serif", face= "plain", size= 20, color= "Black", margin= margin(t=30, r=0, b=0, l=0)),
      axis.title.y= element_text (family="serif", face= "plain", size= 20, color= "Black", margin= margin(t=0, r=30, b=0, l=0)),
      axis.text.x= element_text(family="serif", size=18),
      axis.text.y= element_text(family="serif", size=18),
      axis.line= element_line(size= 0.5, colour= "black"),
      legend.position= "none",
      legend.key= element_rect(color= NULL, fill= alpha("grey",.05)),
      legend.key.size= unit(0.5,"cm"),
      legend.background= element_rect(fill= alpha("grey",.05)),
      legend.title= element_text(family="serif", face= "plain", size= 16, color= "Black"),
        legend.text= element_text(family="serif", face= "plain", size= 16, color= "Black"))
2) Adjusting the spacing of the x-y axis text in the graph.
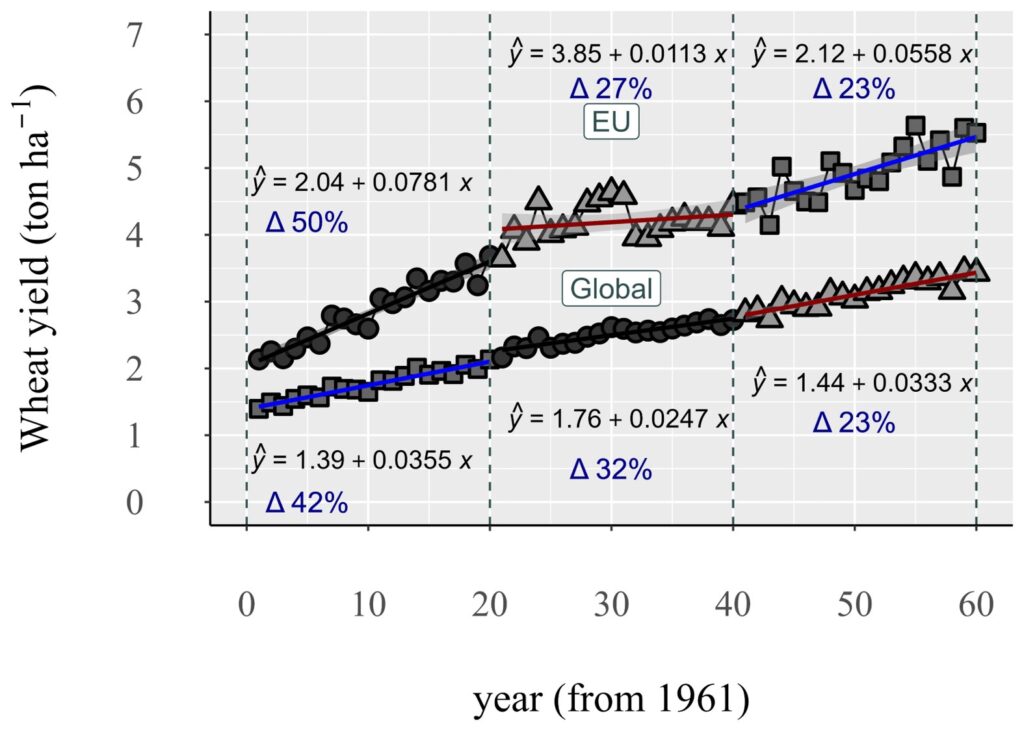
Now, it seems that the x-y axis text is too close to the graph, and I would like to increase the spacing. In this case, you can use the code margin= margin(t=#, r=#, b=#, l=#) once again.
theme(axis.title.x= element_text (family="serif", face= "plain", size= 20, color= "Black", margin= margin(t=30, r=0, b=0, l=0)),
        axis.title.y= element_text (family="serif", face= "plain", size= 20, color= "Black", margin= margin(t=0, r=30, b=0, l=0)),
        axis.text.x= element_text(family="serif", size=18, margin= margin(t=30, r=0, b=0, l=0)),
        axis.text.y= element_text(family="serif", size=18, margin= margin(t=0, r=30, b=0, l=0)),
        axis.line = element_line(size = 0.5, colour = "black"),
        legend.position= "none",
        legend.key= element_rect(color= NULL, fill= alpha("grey",.05)),
        legend.key.size= unit(0.5,"cm"),
        legend.background= element_rect(fill= alpha("grey",.05)),
        legend.title= element_text(family="serif", face= "plain", size= 16, color= "Black"),
        legend.text= element_text(family="serif", face= "plain", size= 16, color= "Black"))
library(readr)
library(ggpmisc)
library (dplyr)

github= "https://raw.githubusercontent.com/agronomy4future/raw_data_practice/main/wheat_yield_trend_over_60_years_by_faostat.csv"
dataA= data.frame(read_csv(url(github),show_col_types = FALSE))
dataA= subset(dataA, location!="S.Korea" & location!="Canada" & location!="US")

dataB= data.frame(dataA %>%
                    group_by(location, trend, year_count) %>%
                    summarise(mean=mean(yield), sd=sd(yield),
                              n=length(yield), se=sd/sqrt(n)))

Fig1= ggplot(data=dataB, aes(x=year_count, y=mean, group1=location)) +
  geom_line(size=0.5,linetype="solid") +
  geom_point(aes(fill=trend, shape=trend),size=3.5, stroke = 1.2) +
  geom_smooth(aes(fill=trend, color=trend), method= lm, level=0.95,
              se=TRUE, linetype=1, size=1, formula= y ~ x) +
  ## to adjust color
  scale_shape_manual(values= c(21,22,24,21,22,24)) +
  scale_fill_manual(values= rep(c("grey20","grey40","grey60"),2)) +
  scale_color_manual(values= rep(c("Black","Blue","Dark red"),2)) +
  ## to set up unit on axis
  scale_x_continuous(breaks= seq(0,60,10),limits = c(0,60)) +
  scale_y_continuous(breaks= seq(0,7,1),limits = c(0,7)) +
  ## to draw line
  geom_vline(xintercept = 20, linetype= "dashed", color="Darkslategray") +
  geom_vline(xintercept = 40, linetype= "dashed", color="Darkslategray") +
  geom_vline(xintercept = 0, linetype= "dashed", color="Darkslategray") +
  geom_vline(xintercept = 60, linetype= "dashed", color="Darkslategray") +
  ## to add text
  geom_label(aes(fontface=6), x=30, y=3.2, label="Global", size=5, fill="White", col="Darkslategray") +
  geom_label(aes(fontface=6), x=30, y=5.7, label="EU", size=5, fill="White", col="Darkslategray") +
  geom_text(aes(fontface=6), x=5, y=4.2, label="Δ 50%", size=5, col="Dark blue") +
  geom_text(aes(fontface=6), x=30, y=6.2, label="Δ 27%", size=5, col="Dark blue") +
  geom_text(aes(fontface=6), x=50, y=6.2, label="Δ 23%", size=5, col="Dark blue") +
  geom_text(aes(fontface=6), x=5, y=0, label="Δ 42%", size=5, col="Dark blue") +
  geom_text(aes(fontface=6), x=30, y=0.5, label="Δ 32%", size=5, col="Dark blue") +
  geom_text(aes(fontface=6), x=50, y=1.2, label="Δ 23%", size=5, col="Dark blue") +
  ## to add linear equation
  stat_poly_eq(data=subset(dataB, trend=="1STEU"),
               aes(label= paste(..eq.label.., sep = "~~~")), label.x.npc= 0.05,
               label.y.npc = 0.7, eq.with.lhs= "italic(hat(y))~'='~",
               eq.x.rhs= "~italic(x)", coef.digits= 3, formula = y ~ x, parse= TRUE, size= 4.5) +
  stat_poly_eq(data=subset(dataB, trend=="2NDEU"),
               aes(label= paste(..eq.label.., sep = "~~~")), label.x.npc= 0.37,
               label.y.npc = 0.95, eq.with.lhs= "italic(hat(y))~'='~",
               eq.x.rhs= "~italic(x)", coef.digits= 3, formula = y ~ x, parse= TRUE, size= 4.5) +
  stat_poly_eq(data=subset(dataB, trend=="3RDEU"),
               aes(label= paste(..eq.label.., sep = "~~~")), label.x.npc= 0.95,
               label.y.npc= 0.95, eq.with.lhs= "italic(hat(y))~'='~",
               eq.x.rhs= "~italic(x)", coef.digits= 3, formula= y ~ x, parse= TRUE, size= 4.5) +
  stat_poly_eq(data=subset(dataB, trend=="1STWorld"),
               aes(label= paste(..eq.label.., sep= "~~~")), label.x.npc= 0.05,
               label.y.npc = 0.1, eq.with.lhs= "italic(hat(y))~'='~",
               eq.x.rhs= "~italic(x)", coef.digits= 3, formula= y ~ x, parse= TRUE, size= 4.5) +
  stat_poly_eq(data=subset(dataB, trend=="2NDWorld"),
               aes(label= paste(..eq.label.., sep = "~~~")), label.x.npc= 0.37,
               label.y.npc= 0.18, eq.with.lhs= "italic(hat(y))~'='~",
               eq.x.rhs= "~italic(x)", coef.digits= 3, formula= y ~ x, parse= TRUE, size= 4.5) +
  stat_poly_eq(data=subset(dataB, trend=="3RDWorld"),
               aes(label= paste(..eq.label.., sep = "~~~")), label.x.npc= 0.95,
               label.y.npc = 0.25, eq.with.lhs= "italic(hat(y))~'='~",
               eq.x.rhs = "~italic(x)", coef.digits= 3, formula= y ~ x, parse= TRUE, size= 4.5) +
  ## to add axis titles
  ylab(bquote("Wheat yield (ton" ~ ha^-1*')')) +
  labs(x="year (from 1961)") +
  ## theme
  theme(axis.title.x= element_text (family="serif", face= "plain", size= 20, color= "Black", margin= margin(t=30, r=0, b=0, l=0)),
        axis.title.y= element_text (family="serif", face= "plain", size= 20, color= "Black", margin= margin(t=0, r=30, b=0, l=0)),
        axis.text.x= element_text(family="serif", size=18, margin= margin(t=30, r=0, b=0, l=0)),
        axis.text.y= element_text(family="serif", size=18, margin= margin(t=0, r=30, b=0, l=0)),
        axis.line = element_line(size = 0.5, colour = "black"),
        legend.position= "none",
        legend.key= element_rect(color= NULL, fill= alpha("grey",.05)),
        legend.key.size= unit(0.5,"cm"),
        legend.background= element_rect(fill= alpha("grey",.05)),
        legend.title= element_text(family="serif", face= "plain", size= 16, color= "Black"),
        legend.text= element_text(family="serif", face= "plain", size= 16, color= "Black"))
Fig1 + windows(width=7, height=5)

ggsave("C:/***/***/***/***/Fig1.jpg",
       Fig1, width=17.78, height=12.7, units="cm", dpi=1000)

→ to set up the pathway to save file; Ctrl + Shift + H