In R STUDIO, how to apply the same font type and size in ggplot?
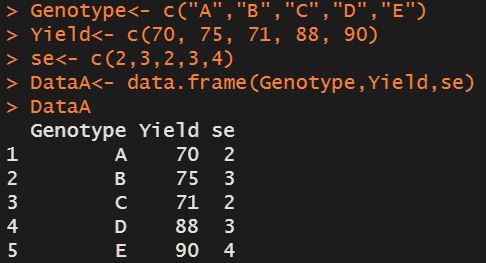
First, let’s generate a simple data.
Genotype<- c("A","B","C","D","E")
Yield<- c(70, 75, 71, 88, 90)
se<- c(2,3,2,3,4)
DataA<- data.frame(Genotype,Yield,se)
DataA
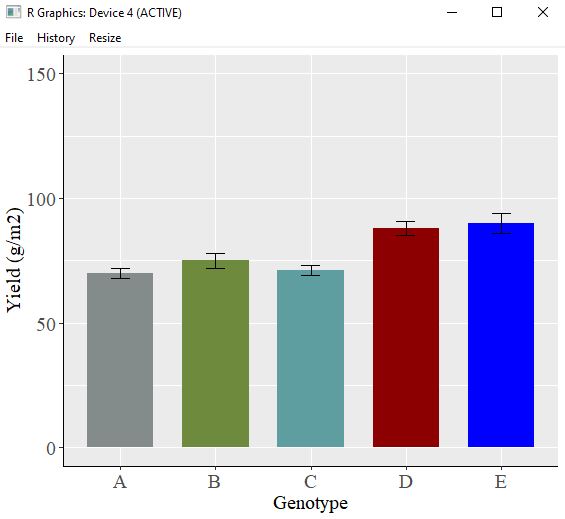
Then I’ll make a bar graph using ggplot2.
library(ggplot2)
ggplot(data=DataA, aes(x=Genotype, y=Yield, fill=Genotype))+
  scale_fill_manual(values=c("azure4","darkolivegreen4","cadetblue",
  "Dark red","Blue")) +
  geom_bar(stat="identity", position="dodge", width=0.7, size=1) +
  geom_errorbar(aes(ymin= Yield-se, ymax=Yield + se),
  position=position_dodge(0.7), width=0.2, color='Black') +
  scale_y_continuous(breaks=seq(0,150,50), limits=c(0,150)) +
  labs(x="Genotype", y="Yield (g/m2)") +
  theme(axis.title.x= element_text (family="serif", size=15, color="black"),
        axis.title.y= element_text (family="serif", size=15, color="black"),
        axis.text.x= element_text(family="serif", size=15),
        axis.text.y= element_text(family="serif", size=15),
        legend.position= 'none',
        axis.line= element_line(size=0.5, colour="black")) +
  windows(width=6, height=5)
Now, I made a bar graph like above, but in the code to make this bar graph, I repeated font type and size over and over to set up the same font type and size in both graph title and text (also in x and y axis).
  theme(axis.title.x= element_text (family="serif", size=15, color="black"),
        axis.title.y= element_text (family="serif", size=15, color="black"),
        axis.text.x= element_text(family="serif", size=15),
        axis.text.y= element_text(family="serif", size=15),
        legend.position= 'none',
        axis.line= element_line(size=0.5, colour="black")) +
  windows(width=6, height=5)
I want to reduce this repeated codes, and the solution is using theme_grey().
axis.title.x= element_text (family="serif", size=15, color="black"), axis.title.y= element_text (family="serif", size=15, color="black"), axis.text.x= element_text(family="serif", size=15), axis.text.y= element_text(family="serif", size=15),
these codes can be replaced by theme_grey(base_size=15, base_family="serif")
Then, this is a new code. The length of code was reduced, and it seems a more simple code.
library(ggplot2)
ggplot(data=DataA, aes(x=Genotype, y=Yield, fill=Genotype))+
  scale_fill_manual(values=c("azure4","darkolivegreen4","cadetblue",
  "Dark red","Blue")) +
  geom_bar(stat="identity", position="dodge", width=0.7, size=1) +
  geom_errorbar(aes(ymin= Yield-se, ymax=Yield + se),
  position=position_dodge(0.7), width=0.2, color='Black') +
  scale_y_continuous(breaks=seq(0,150,50), limits=c(0,150)) +
  labs(x="Genotype", y="Yield (g/m2)") +
  theme_grey(base_size=15, base_family="serif")+
  theme(legend.position= 'none',
        axis.line= element_line(size=0.5, colour="black")) +
  windows(width=6, height=5)
and you can obtain the same bar graph.
theme_grey()is only applied the format of panel, which means font type and size of legend is independent from theme_grey(). So we need to set it up separately.
