[R package] Normalization Methods for Data Scaling (Feat. normtools)
■ [Data article] Data Normalization Techniques: Excel and R as the Initial Steps in Machine Learning
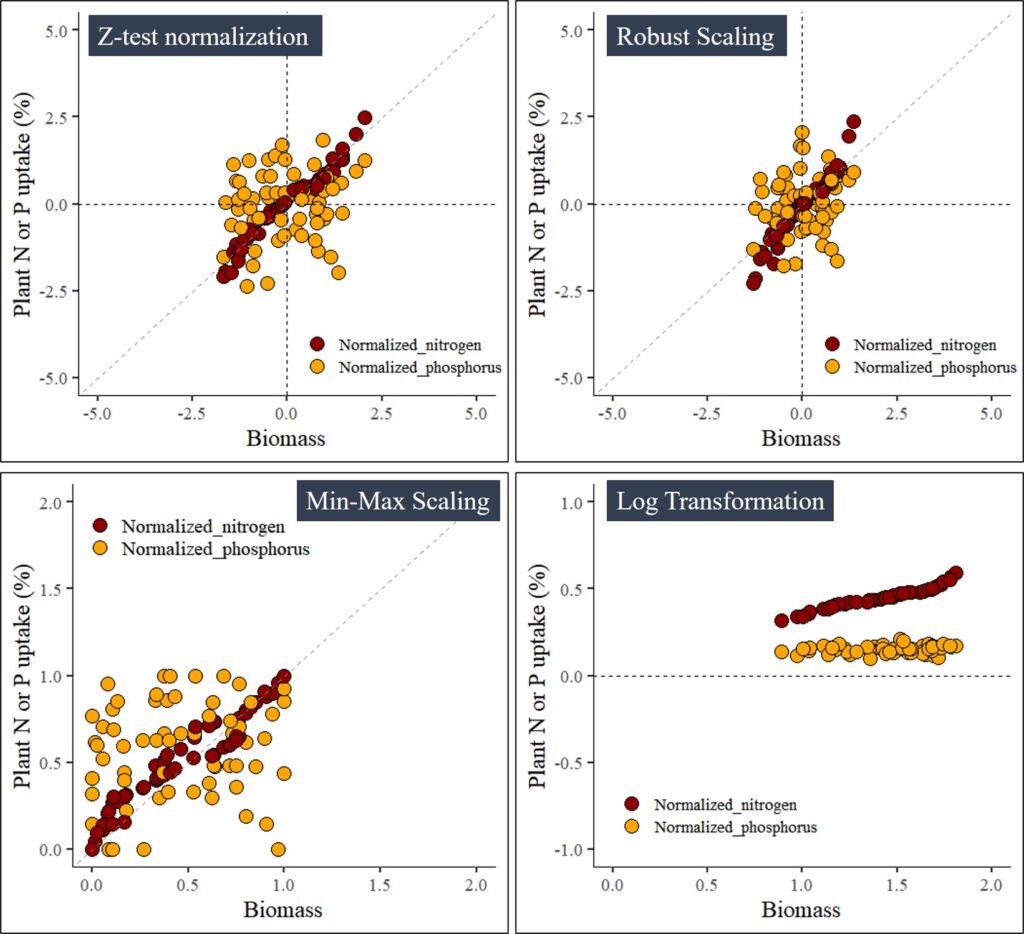
In my previous post, I explained how to normalize data using various methods and demonstrated how to perform the calculations for each method. To simplify these calculations, I recently developed an R package that easily generates normalized data.
1. Install the normtools() package
if(!require(remotes)) install.packages("remotes")
if (!requireNamespace("normtools", quietly = TRUE)) {
  remotes::install_github("agronomy4future/normtools")
}
library(remotes)
library(normtools)
2. Basic code format
# Using method=1 for Z-test normalization
z_test= normtools(df, c("Env1", "Env2",""), c("y1","y1",""),
                  method= 1) # 1 or "z_test"

# Using method=2 for Robust Scaling
robust_scaling= normtools(df, c("Env1", "Env2",""), c("y1","y1",""),
                          method= 2) # 2 or "robust_scaling"

# Using method=3 for Min-Max Scaling
min_max= normtools(df, c("Env1", "Env2",""), c("y1","y1",""),
                   method= 3) # 3 or "min_max_saling"

# Using method=4 for Log Transformation
log_transformation= normtools(df, c("Env1", "Env2",""), c("y1","y1",""),
                              method= 4) # 4 or "log_transformation"
3. Practice with actual dataset (data upload)
if(!require(readr)) install.packages("readr")
library(readr)
github="https://raw.githubusercontent.com/agronomy4future/raw_data_practice/main/biomass_N_P.csv"
df= data.frame(read_csv(url(github), show_col_types=FALSE))

head(df,5)
  season cultivar treatment rep biomass nitrogen phosphorus
1   2022      cv1        N0   1    9.16     1.23       0.41
2   2022      cv1        N0   2   13.06     1.49       0.45
3   2022      cv1        N0   3    8.40     1.18       0.31
4   2022      cv1        N0   4   11.97     1.42       0.48
5   2022      cv1        N1   1   24.90     1.77       0.49
.
.
.
4. Normalize data
4.1. Z-test normalization
z_test= normtools(df, c("season", "cultivar"), c("biomass","nitrogen","phosphorus"),
                  method= 1) # 1 or "z_test"
# data roation
if(!require(readr)) install.packages("dplyr")
if(!require(readr)) install.packages("tidyr")
library(dplyr)
library(tidyr)
z_test_result= data.frame(z_test %>%
pivot_longer(
cols= c(Normalized_nitrogen, Normalized_phosphorus),
names_to= "nutrient",
values_to= "uptake")
)
# graph for Z-test normalization
if(!require(readr)) install.packages("ggplot2")
library(ggplot2)
ggplot(data=z_test_result, aes(x=Normalized_biomass, y=uptake)) +
geom_point(aes(fill=as.factor(nutrient), shape=as.factor(nutrient)),
color="black", size=5) +
scale_fill_manual(values= c("darkred","orange")) +
scale_shape_manual(values= c(21,21)) +
scale_x_continuous(breaks=seq(-5,5,2.5),limits=c(-5,5)) +
scale_y_continuous(breaks=seq(-5,5,2.5),limits=c(-5,5)) +
geom_vline(xintercept=0, linetype="dashed", color="black") +
geom_hline(yintercept=0, linetype="dashed", color= "black") +
geom_abline(slope=1, linetype= "dashed", color="grey55",
linewidth=0.5) +
labs(x="Biomass", y="Plant N or P uptake (%)") +
theme_classic(base_size=18, base_family="serif") +
theme(legend.position=c(0.78,0.12),
legend.title=element_blank(),
legend.key=element_rect(color="white", fill="white"),
legend.text=element_text(family="serif", face="plain",
size=13, color="black"),
legend.background= element_rect(fill="white"),
axis.line = element_line(linewidth = 0.5, colour="black"))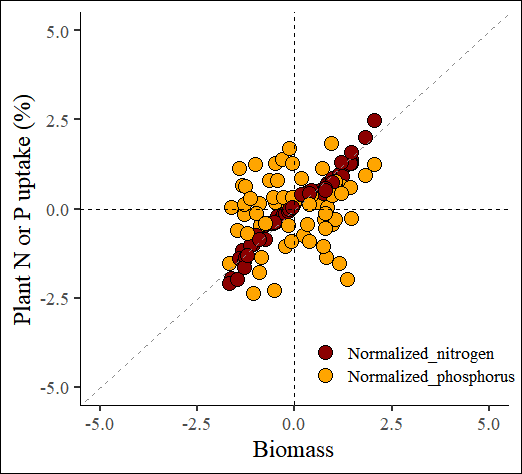
4.2. Robust Scaling
robust_scaling= normtools(df, c("season", "cultivar"), c("biomass","nitrogen","phosphorus"),
                          method= 2) # 2 or "robust_scaling"
# data roation
if(!require(readr)) install.packages("dplyr")
if(!require(readr)) install.packages("tidyr")
library(dplyr)
library(tidyr)
robust_scaling_result= data.frame(robust_scaling %>%
pivot_longer(
cols= c(Normalized_nitrogen, Normalized_phosphorus),
names_to= "nutrient",
values_to= "uptake")
)
# graph for Z-test normalization
if(!require(readr)) install.packages("ggplot2")
library(ggplot2)
ggplot(data=robust_scaling_result, aes(x=Normalized_biomass, y=uptake)) +
geom_point(aes(fill=as.factor(nutrient), shape=as.factor(nutrient)),
color="black", size=5) +
scale_fill_manual(values= c("darkred","orange")) +
scale_shape_manual(values= c(21,21)) +
scale_x_continuous(breaks=seq(-5,5,2.5),limits=c(-5,5)) +
scale_y_continuous(breaks=seq(-5,5,2.5),limits=c(-5,5)) +
geom_vline(xintercept=0, linetype="dashed", color="black") +
geom_hline(yintercept=0, linetype="dashed", color= "black") +
geom_abline(slope=1, linetype= "dashed", color="grey55",
linewidth=0.5) +
labs(x="Biomass", y="Plant N or P uptake (%)") +
theme_classic(base_size=18, base_family="serif") +
theme(legend.position=c(0.78,0.12),
legend.title=element_blank(),
legend.key=element_rect(color="white", fill="white"),
legend.text=element_text(family="serif", face="plain",
size=13, color="black"),
legend.background= element_rect(fill="white"),
axis.line = element_line(linewidth = 0.5, colour="black"))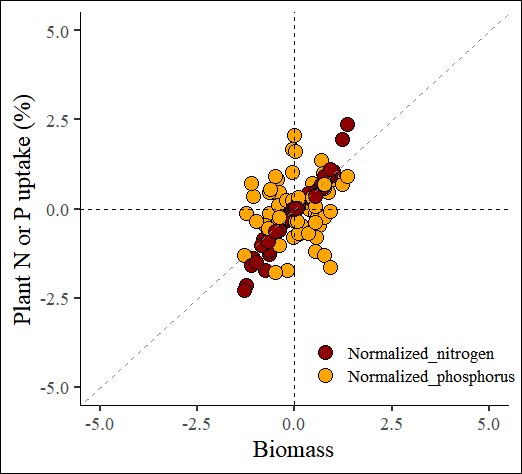
4.3. Min-Max Scaling
min_max_scaling= normtools(df, c("season", "cultivar"), c("biomass","nitrogen","phosphorus"),
                   method= 3) # 3 or "min_max_saling"
# data roation
if(!require(readr)) install.packages("dplyr")
if(!require(readr)) install.packages("tidyr")
library(dplyr)
library(tidyr)
min_max_scaling_result= data.frame(min_max_scaling %>%
pivot_longer(
cols= c(Normalized_nitrogen, Normalized_phosphorus),
names_to= "nutrient",
values_to= "uptake")
)
# graph for Z-test normalization
if(!require(readr)) install.packages("ggplot2")
library(ggplot2)
ggplot(data=min_max_scaling_result, aes(x=Normalized_biomass, y=uptake))+
geom_point(aes(fill=as.factor(nutrient),
shape=as.factor(nutrient)), color="black", size=5) +
scale_fill_manual(values=c("darkred","orange")) +
scale_shape_manual(values=c(21,21)) +
scale_x_continuous(breaks=seq(0,2,0.5), limits=c(0,2)) +
scale_y_continuous(breaks=seq(0,2,0.5), limits=c(0,2)) +
geom_abline(slope=1, linetype= "dashed", color="grey55",
linewidth=0.5) +
labs(x="Biomass", y="Plant N or P uptake (%)") +
theme_classic(base_size=18, base_family="serif") +
theme(legend.position=c(0.80,0.12),
legend.title=element_blank(),
legend.key=element_rect(color="white", fill="white"),
legend.text=element_text(family="serif", face="plain",size=15,
color="black"),
legend.background=element_rect(fill="white"),
axis.line=element_line(linewidth=0.5, colour="black"))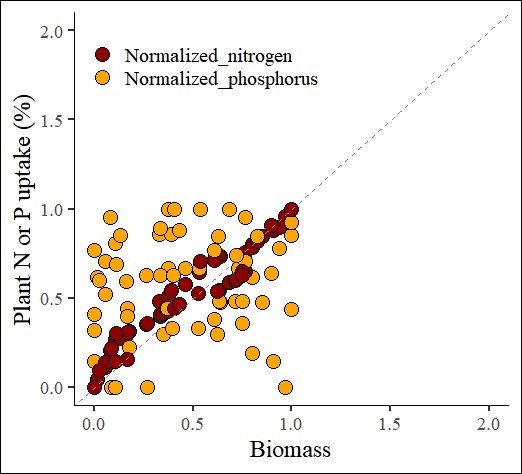
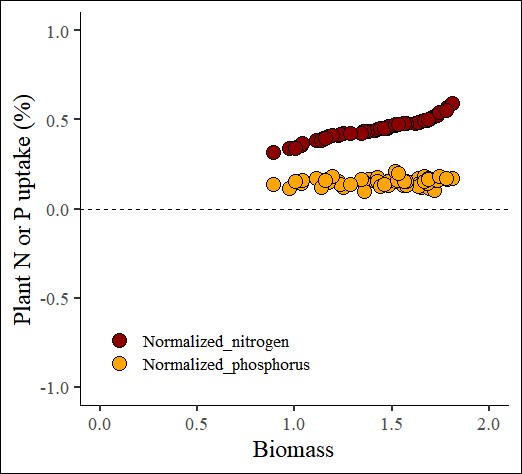
4.4. Log Transformation
log_transformation= normtools(df, c("season", "cultivar"), c("biomass","nitrogen","phosphorus"),
                              method= 4) # 4 or "log_transformation"
# data roation
if(!require(readr)) install.packages("dplyr")
if(!require(readr)) install.packages("tidyr")
library(dplyr)
library(tidyr)
log_transformation_result= data.frame(log_transformation %>%
pivot_longer(
cols= c(Normalized_nitrogen, Normalized_phosphorus),
names_to= "nutrient",
values_to= "uptake")
)
# graph for Z-test normalization
if(!require(readr)) install.packages("ggplot2")
library(ggplot2)
ggplot(data=log_transformation_result, aes(x=Normalized_biomass, y=uptake)) +
geom_point(aes(fill=as.factor(nutrient), shape=as.factor(nutrient)),
color="black", size=5) +
scale_fill_manual(values= c("darkred","orange")) +
scale_shape_manual(values= c(21,21)) +
scale_x_continuous(breaks=seq(0,2,0.5),limits=c(0,2)) +
scale_y_continuous(breaks=seq(-1,1,0.5),limits=c(-1,1)) +
geom_hline(yintercept=0, linetype="dashed", color="black") +
labs(x="Biomass", y="Plant N or P uptake (%)") +
theme_classic(base_size=18, base_family="serif") +
theme(legend.position=c(0.2,0.15),
legend.title=element_blank(),
legend.key=element_rect(color="white", fill="white"),
legend.text=element_text(family="serif", face="plain", size=13,
color="black"),
legend.background= element_rect(fill="white"),
axis.line = element_line(linewidth = 0.5, colour="black"))