How to create separate linear and quadratic regression graphs for each group in the same panel using R?
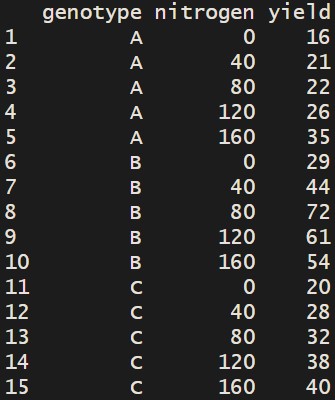
When we draw regression lines for a group, they are usually of the same type, such as simple linear regression. Here is an example using yield data for different nitrogen rates per genotype.
nitrogen=rep(c(0,40,80,120,160),time=3)
yield=c(16,21,22,26,35,29,44,72,61,54,20,28,32,38,40)
genotype=rep(c("A","B","C"),each=5)
dataA=data.frame(genotype,nitrogen,yield)
dataA
Then, the regression graph for each group would be shown below.
library(ggplot2)
ggplot(data=dataA, aes(x=nitrogen, y=yield))+

  geom_smooth(aes(group=genotype, color=genotype),
              method='lm', linetype=1, se=FALSE,
              formula=y~x, linewidth=0.5)+
  geom_point(aes(fill=genotype, shape=genotype),
             color="black", size=4)+
  scale_color_manual(values=c("Dark red","grey15","Dark blue"))+
  scale_fill_manual(values=c("Dark red","grey15","Dark blue"))+
  scale_shape_manual(values=c(21,21,21))+
  scale_x_continuous(breaks=seq(0,160,40), limits=c(0,160))+
  scale_y_continuous(breaks=seq(0,80,20), limits=c(0,80))+
  theme_classic(base_size=20, base_family="serif")+
  theme(legend.position=c(0.89,0.13),
        legend.title=element_blank(),
        legend.key=element_rect(color=alpha("white",.001),
                   fill=alpha("white",.001)),
        legend.background=element_rect(fill=alpha("white",.001)),
        axis.line=element_line(linewidth=0.5, colour="black"))+
  windows(width=5.5, height=5)

I think it would be better to show the quadratic regression line for genotype A. In this case, how can we create separate linear and quadratic regression graphs for each group in the same panel?
Data filtering: necessary step for creating separate linear and quadratic regression graphs for each genotype in R
Genotype B will use a quadratic model, while genotypes A and C will use a linear model. Therefore, it is necessary to filter the data to provide different model formulas.
I’ll divide the data as follows.
library(ggplot2)
library(dplyr)

dataA %>%
ggplot(aes(x=nitrogen, y=yield))+

  geom_smooth(data=filter(dataA, genotype=="A"),
              method="lm",aes(color=genotype),
              linetype=1, se=FALSE, formula=y~x)+

  geom_smooth(data=filter(dataA, genotype=="B"),
              method="lm",aes(color=genotype),
              linetype=1, se=FALSE,
              formula=y~poly(x,2, raw=TRUE))+

  geom_smooth(data=filter(dataA, genotype=="C"),
              method="lm",aes(color=genotype),
              linetype=1, se=FALSE, formula=y~x)+

  geom_point(aes(fill=genotype, shape=genotype),
             color="black", size=4)+
  scale_color_manual(values=c("Dark red","grey15","Dark blue"))+
  scale_fill_manual(values=c("Dark red","grey15","Dark blue"))+
  scale_shape_manual(values=c(21,21,21))+
  scale_x_continuous(breaks=seq(0,160,40), limits=c(0,160))+
  scale_y_continuous(breaks=seq(0,80,20), limits=c(0,80))+
  labs(x="Nitrogen", y="Yield") +
  theme_classic(base_size=20, base_family="serif")+
  theme(legend.position=c(0.89,0.13),
        legend.title=element_blank(),
        legend.key=element_rect(color=alpha("white",.001),
                   fill=alpha("white",.001)),
        legend.background=element_rect(fill=alpha("white",.001)),
        axis.line=element_line(linewidth=0.5, colour="black"))+
  windows(width=5.5, height=5)
Now, independent linear and quadratic regression graphs for each group were created in the same panel.
## full code
nitrogen=rep(c(0,40,80,120,160),time=3)
yield=c(16,21,22,26,35,29,44,72,61,54,20,28,32,38,40)
genotype=rep(c("A","B","C"),each=5)
dataA=data.frame(genotype,nitrogen,yield)
library(ggplot2)
library(dplyr)

dataA %>%
ggplot(aes(x=nitrogen, y=yield))+
  geom_smooth(data=filter(dataA, genotype=="A"),
              method="lm",aes(color=genotype),
              linetype=1, se=FALSE, formula=y~x)+
  geom_smooth(data=filter(dataA, genotype=="B"),
              method="lm",aes(color=genotype),
              linetype=1, se=FALSE,
              formula=y~poly(x,2, raw=TRUE))+
  geom_smooth(data=filter(dataA, genotype=="C"),
              method="lm",aes(color=genotype),
              linetype=1, se=FALSE, formula=y~x)+
  geom_point(aes(fill=genotype, shape=genotype),
             color="black", size=4)+
  scale_color_manual(values=c("Dark red","grey15","Dark blue"))+
  scale_fill_manual(values=c("Dark red","grey15","Dark blue"))+
  scale_shape_manual(values=c(21,21,21))+
  scale_x_continuous(breaks=seq(0,160,40), limits=c(0,160))+
  scale_y_continuous(breaks=seq(0,80,20), limits=c(0,80))+
  labs(x="Nitrogen", y="Yield") +
  theme_classic(base_size=20, base_family="serif")+
  theme(legend.position=c(0.89,0.13),
        legend.title=element_blank(),
        legend.key=element_rect(color=alpha("white",.001),
        fill=alpha("white",.001)),
        legend.background=element_rect(fill=alpha("white",.001)),
        axis.line=element_line(linewidth=0.5, colour="black"))+
  windows(width=5.5, height=5)