Converting Rows to Columns in R: A Guide to Transposing Data (feat. pivot_wider and pivot_longer)
When data is arranged, it can be structured either vertically (row-based) or horizontally (column-based). The choice depends on your preference for organizing data. However, when running statistics, data should be arranged row-based, as variables need to be in the same column. On the other hand, when calculating per variable, it is much easier to organize data column-based, allowing for simpler calculations. Regardless of the approach, well-organized data is essential, and the ability to restructure data is a valuable skill. Today, I will introduce how to automatically reshape data both vertically and horizontally using R.
Let’s upload a dataset in R.
library(readr)
github="https://raw.githubusercontent.com/agronomy4future/raw_data_practice/main/wheat_grain_Fe_uptake.csv"
dataA= data.frame(read_csv(url(github), show_col_types= FALSE))

    Location Season Genotype Reps Iron_ton_ha      Stage   Fe
1       East   2021      CV1    1     21.7127 Vegetative 0.44
2       East   2021      CV1    2      8.7340 Vegetative 0.30
3       East   2021      CV1    3      9.5003 Vegetative 0.31
4       East   2021      CV1    4      5.9481 Vegetative 0.37
5       East   2021      CV1    5      7.4608 Vegetative 0.30
6       East   2021      CV1    6     20.5326 Vegetative 0.33
7       East   2021      CV1    7     19.8532 Vegetative 0.29
8       East   2021      CV1    8      7.9718 Vegetative 0.35
9       East   2021      CV1    9     15.0087 Vegetative 0.38
10      East   2021      CV1   10      5.6608 Vegetative 0.40
.
.
.
Now, I’d like to move the variables in the ‘Stage’ column to individual columns. I’ll use pivot_wider()
library(dplyr)
library(tidyr)

dataB= data.frame(dataA %>%
                  group_by(Location, Season, Genotype, Iron_ton_ha, Stage) %>%
                  pivot_wider(names_from= Stage, values_from=Fe))

dataB
    Location Season Genotype Reps Iron_ton_ha Vegetative Reproductive Maturity
1       East   2021      CV1    1     21.7127       0.44         0.37     0.13
2       East   2021      CV1    2      8.7340       0.30         0.32     0.14
3       East   2021      CV1    3      9.5003       0.31         0.33     0.12
4       East   2021      CV1    4      5.9481       0.37         0.30     0.18
5       East   2021      CV1    5      7.4608       0.30         0.34     0.12
6       East   2021      CV1    6     20.5326       0.33         0.33     0.24
7       East   2021      CV1    7     19.8532       0.29         0.31     0.21
8       East   2021      CV1    8      7.9718       0.35         0.31     0.17
9       East   2021      CV1    9     15.0087       0.38         0.30     0.32
10      East   2021      CV1   10      5.6608       0.40         0.31     0.14
Data was re-structured as horizontally. Let’s change it as vertically again.
dataC= data.frame(dataB %>%
       pivot_longer(
       cols= c(Vegetative, Reproductive, Maturity),
       names_to= "Stage",
       values_to= "Fe"))

dataC
    Location Season Genotype Reps Iron_ton_ha        Stage   Fe
1       East   2021      CV1    1     21.7127   Vegetative 0.44
2       East   2021      CV1    1     21.7127 Reproductive 0.37
3       East   2021      CV1    1     21.7127     Maturity 0.13
4       East   2021      CV1    2      8.7340   Vegetative 0.30
5       East   2021      CV1    2      8.7340 Reproductive 0.32
6       East   2021      CV1    2      8.7340     Maturity 0.14
7       East   2021      CV1    3      9.5003   Vegetative 0.31
8       East   2021      CV1    3      9.5003 Reproductive 0.33
9       East   2021      CV1    3      9.5003     Maturity 0.12
10      East   2021      CV1    4      5.9481   Vegetative 0.37
.
.
.
Practice
Here is a practice for you.
library(readr)
github="https://raw.githubusercontent.com/agronomy4future/raw_data_practice/main/yield_per_location.csv"
dataA=data.frame(read_csv(url(github), show_col_types=FALSE))
dataA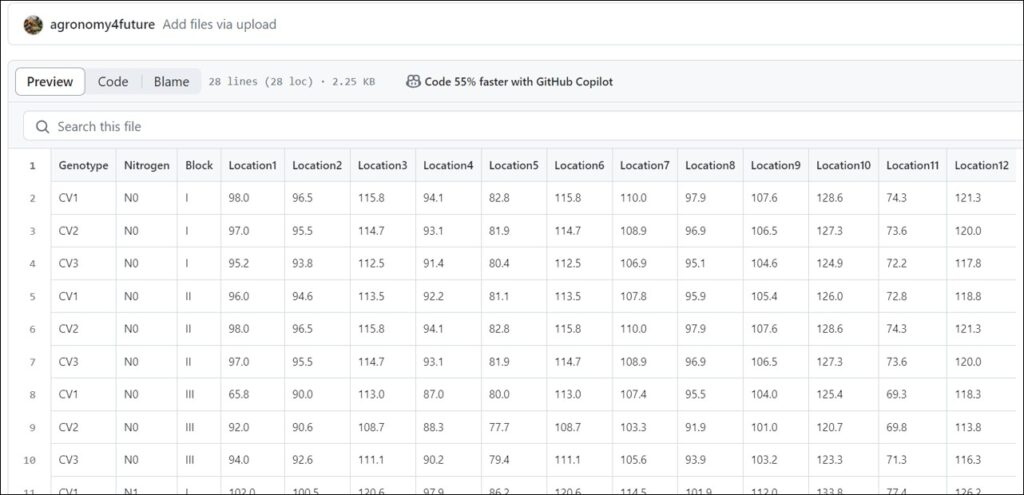
You can transpose the columns to rows using pivot_longer(). The answer code is in the below code sumamry.
full code: https://github.com/agronomy4future/r_code/blob/main/Converting_Rows_to_Columns_in_R_A_Guide_to_Transposing_Data_(feat_pivot_wider_and_pivot_longer).ipynb