Simple linear regression (4/5)- t value on the slope and intercept
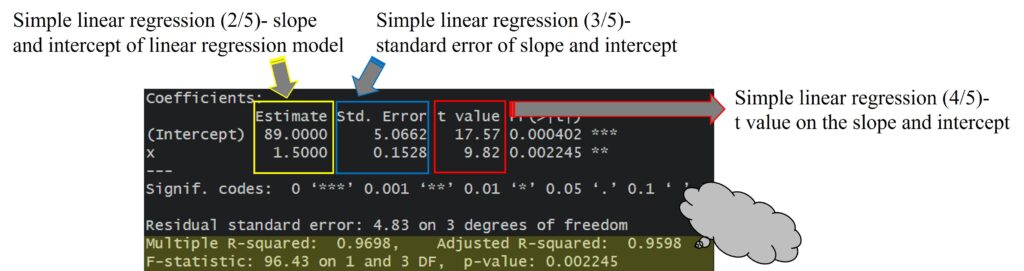
Simple Linear Regression Series
1) Simple linear regression (1/5)- correlation and covariance
2) Simple linear regression (2/5)- slope and intercept of linear regression model
3) Simple linear regression (3/5)- standard error of slope and intercept
4) Simple linear regression (4/5)- t value on the slope and intercept
5) Simple linear regression (5/5)- Coefficient of determination
In my previous post, I explained how to calculate standard error of slope and intercept in simple linear regression model. Now, I’ll explain how to calculate t value on the slope and intercept.
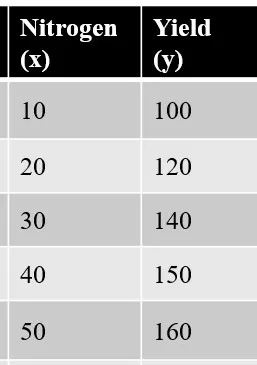
Let’s talk about this data again!! According to amount of nitrogen fertilizer, I investigate how yield is changed. If you run statistical programs, you will obtain the result like below.
x<- c(10,20,30,40,50)
y<- c(100,120,140,150,160)
dataA<- data.frame(x,y)
summary(lm(y~x))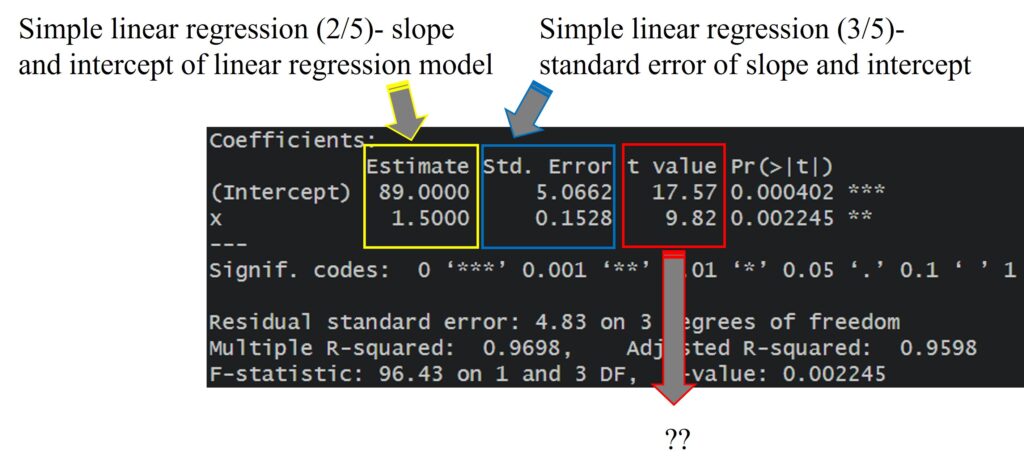
If you well followed my previous posts, now you can understand how to calculate slope and intercept of linear regression model, and also how to calculate standard error of slope and intercept. Now the following question is how to calculate t value in the table.
1 sample t-test
In simple linear regression model, t-value is basically based on ‘1 sample t-test.’
This is the equation for 1 sample t-test.
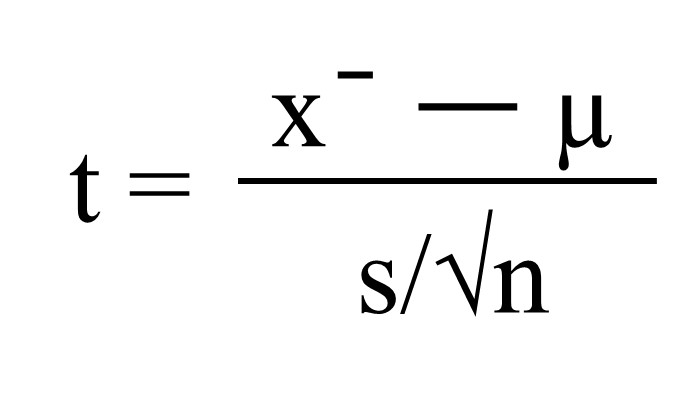
Basically, x ̄ is the mean of observed value, µ is the mean (estimated as the mean of population), s is standard deviation, and n is sample number, but this equation is standard error (s/√n). We already calculated standard error for intercept and slope repectively in previous post.
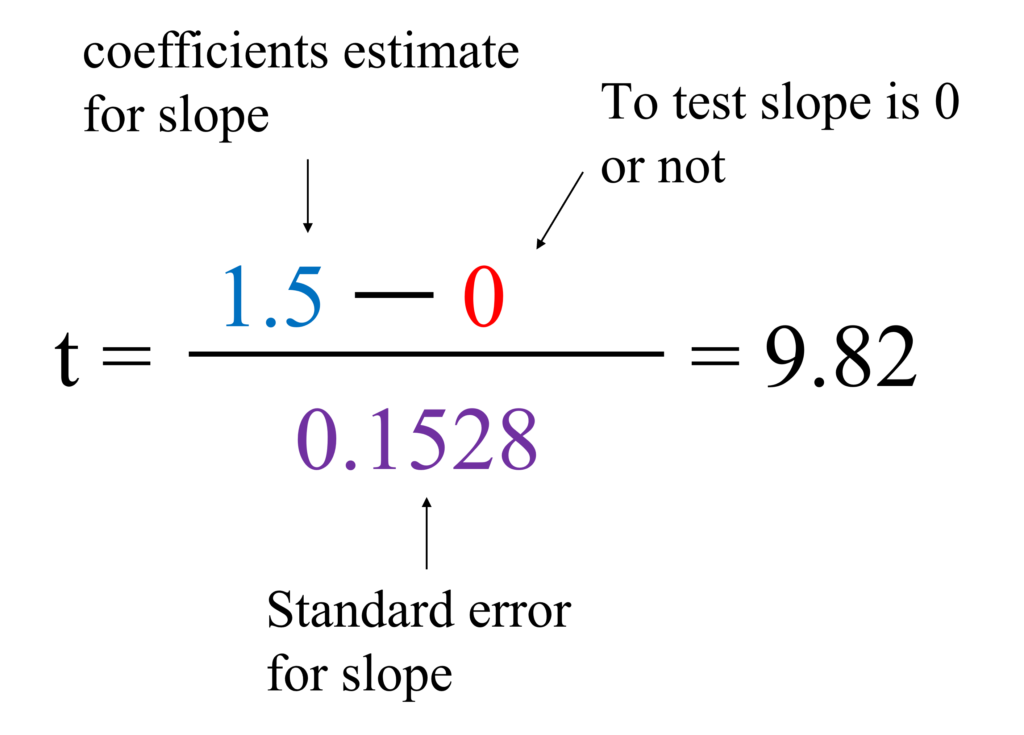
However, in simple linear regression model, x will be coefficients estimate for intercept and slope repectively, and µ will be 0. This is because it’s the test whether intercept and slope is 0 or not.
Then, let’s calculate t-value for intercept and slope respectively.
1) Intercept

2) Slope
Then, let’s calcualte p-value for each t value. In Excel, we can simply check the p-value if we know t-value with degree of freedom.
= tdist (t, df, tail) ## tail; 1 = one tailed, 2 = two tailedSo, let’s check p-value for our t-value for intercept and slope.
=TDIST(17.57,3,2)   = 0.000402
=TDIST(9.82,3,2)    = 0.002245
Why it’s two-tailed test? One-tailed test is about ‘greater or less’, while two-tailed test is about same and not the same. Our hypothesis was whether intercept and slope is 0 or not (same or not the same). Therefore, it’s two-tailed test.
Please check all values we calcualted with the result R provided.
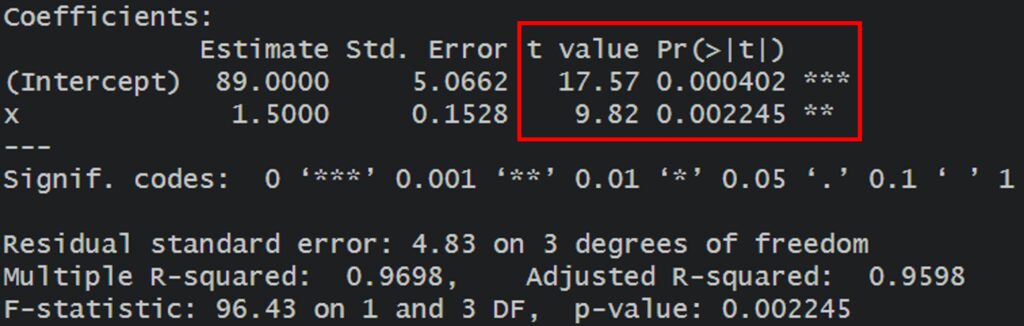
It’s the same values. From now, we can calculate all values which statistical programs provide. Now our final challenge would be to understand how to calculate R2
The answer will be in the next post!!